Fig. 3
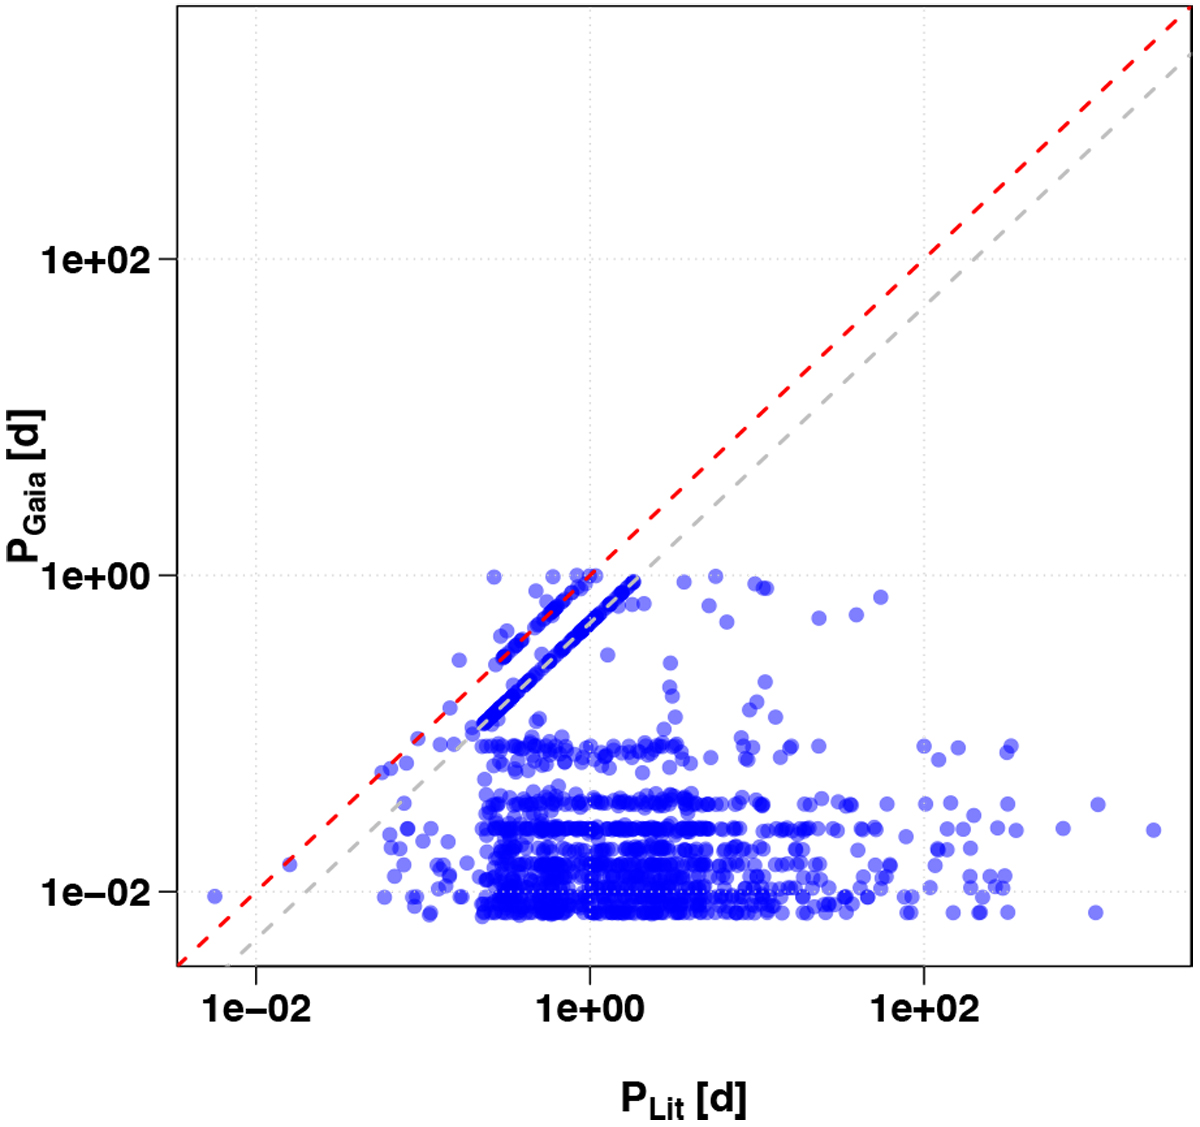
Gaia short-timescale period as a function of the literature period for the crossmatched periodic sources flagged as short-timescale candidates from the variogram analysis. The red and grey dashed lines correspond to PGaia = PLit and PGaia = PLit∕2, respectively.In total, the literature period or half of the literature period is recovered only for 23% of the crossmatched sources with PLit ≤ 1 d.
Current usage metrics show cumulative count of Article Views (full-text article views including HTML views, PDF and ePub downloads, according to the available data) and Abstracts Views on Vision4Press platform.
Data correspond to usage on the plateform after 2015. The current usage metrics is available 48-96 hours after online publication and is updated daily on week days.
Initial download of the metrics may take a while.