Fig. 4.
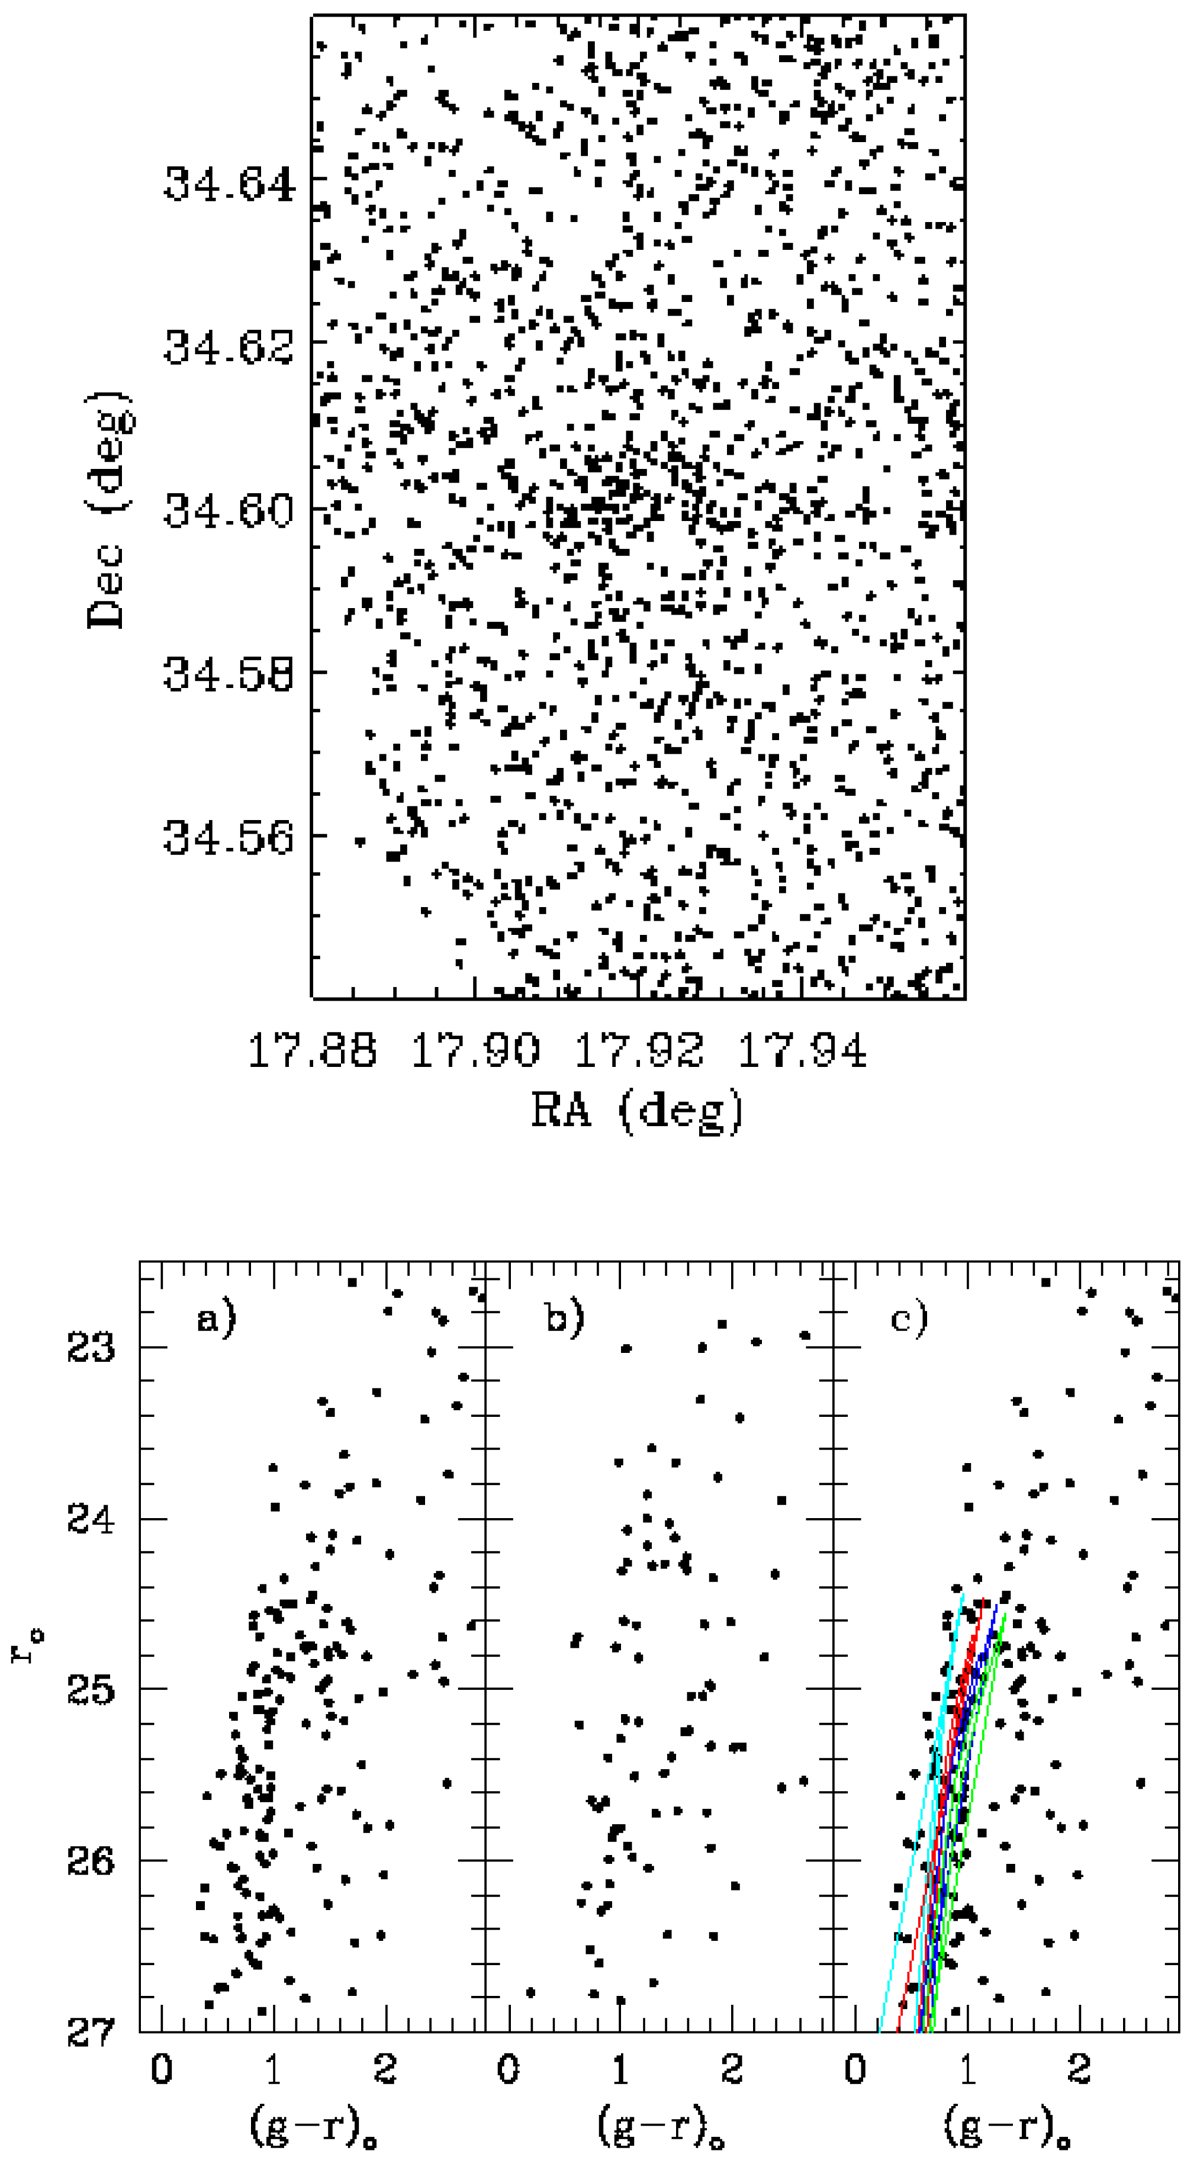
Upper panel: star count map of Do I showing the stars detected in both g and r-bands in our GTC observations. Lower panel: de-reddened (g − r)0 vs. r0 color-magnitude diagram of Do I (panel a) and its control field (panel b). Panel c shows a comparison of the Do I CMD with the PARSEC isochrones (solid lines) with an age of 13 Gyr shifted assuming a distance modulus of (m − M)=27.6 mag. The metallicities of the isochones are Z = 0.0001 (cyan), 0.0003 (red), 0.0005 (blue) and 0.0007 (green), respectively.
Current usage metrics show cumulative count of Article Views (full-text article views including HTML views, PDF and ePub downloads, according to the available data) and Abstracts Views on Vision4Press platform.
Data correspond to usage on the plateform after 2015. The current usage metrics is available 48-96 hours after online publication and is updated daily on week days.
Initial download of the metrics may take a while.