Free Access
Fig. 5.
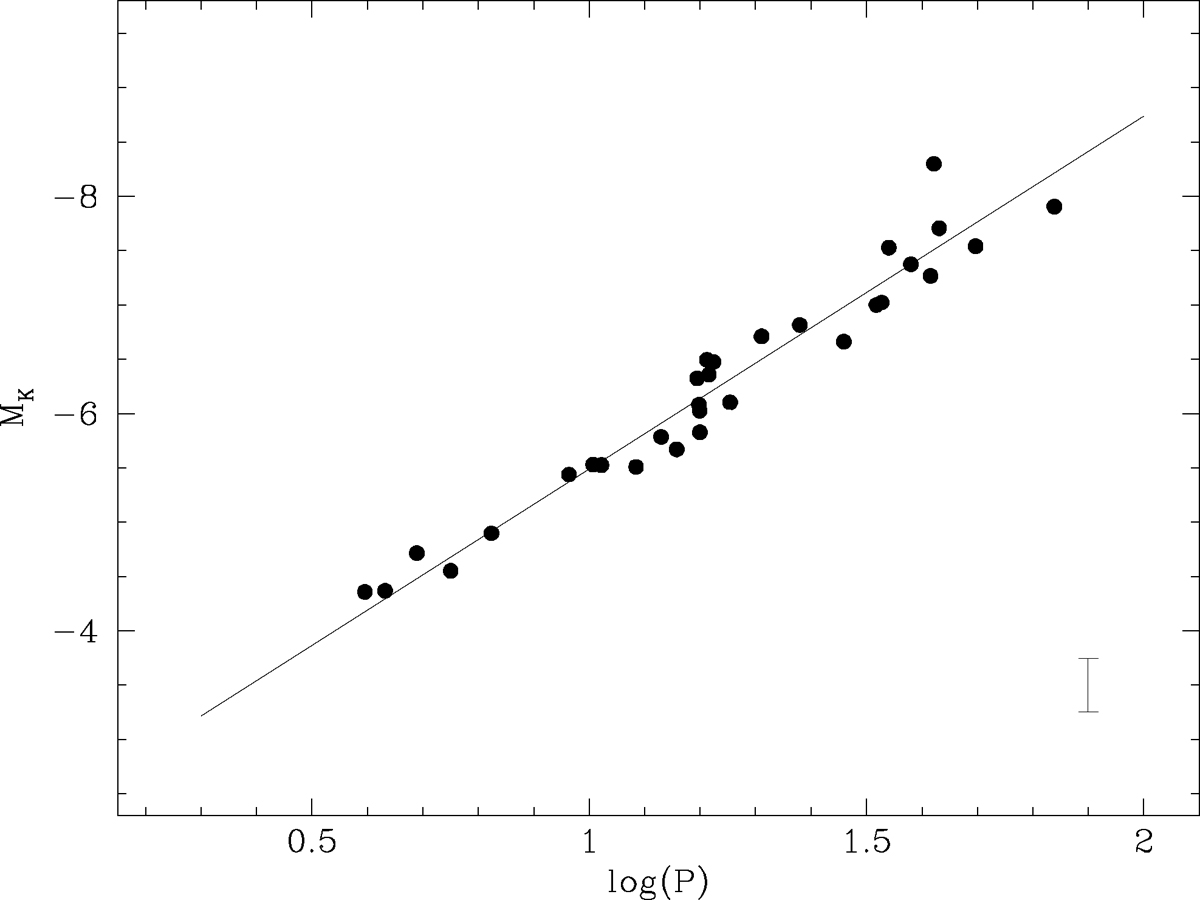
Period-luminosity relation in the K band for the SMC Cepheids. The line represents the LMC slope as determined by Macri et al. (2015) shifted to match the SMC. A typical error bar is shown in the lower right.
Current usage metrics show cumulative count of Article Views (full-text article views including HTML views, PDF and ePub downloads, according to the available data) and Abstracts Views on Vision4Press platform.
Data correspond to usage on the plateform after 2015. The current usage metrics is available 48-96 hours after online publication and is updated daily on week days.
Initial download of the metrics may take a while.