Fig. 9
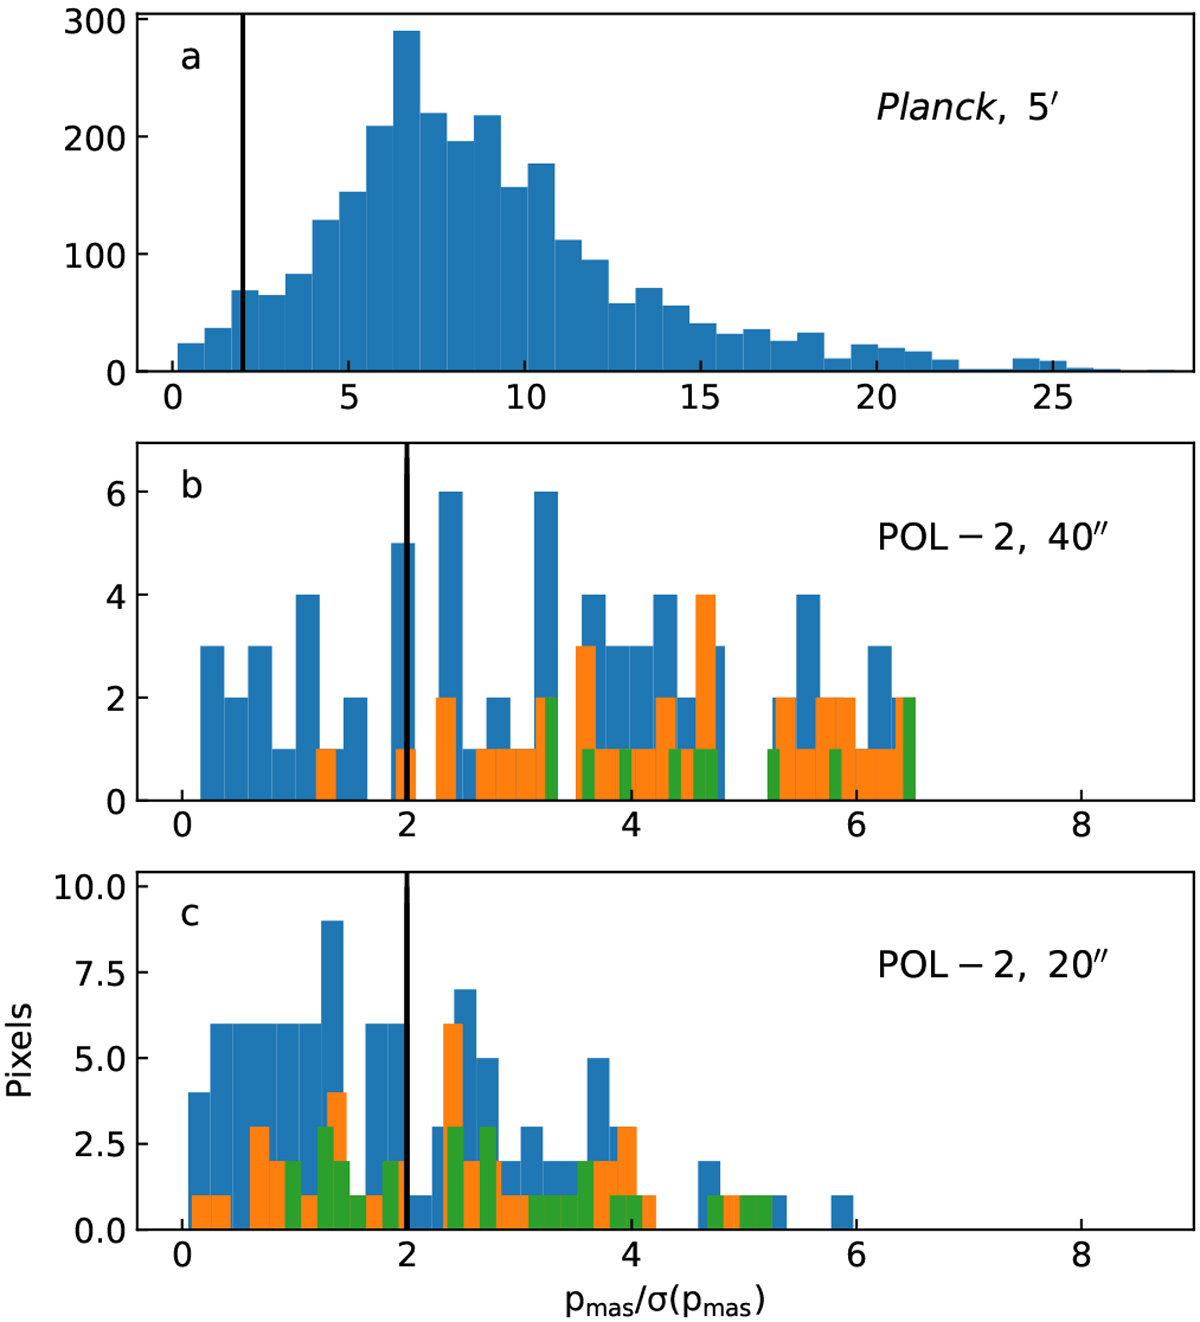
S/N of polarisation fraction. The panels correspond to Planck data at 5′ resolution (panel a) and to POL-2 data at 40′′ (panel b) and 20′′ (panel c) resolution. Panel a includes all data over a 2° × 2° area. In panels b and c, histograms show POL-2 data above column density thresholds of 1, 2, and 3 times N(H2) = 1022 cm−2 (blue, orange, and green histograms, respectively). Vertical lines at 2 indicate an approximate limit above which the pmas estimates are reliable. All data are sampled at steps FWHM/2.
Current usage metrics show cumulative count of Article Views (full-text article views including HTML views, PDF and ePub downloads, according to the available data) and Abstracts Views on Vision4Press platform.
Data correspond to usage on the plateform after 2015. The current usage metrics is available 48-96 hours after online publication and is updated daily on week days.
Initial download of the metrics may take a while.