Fig. 8
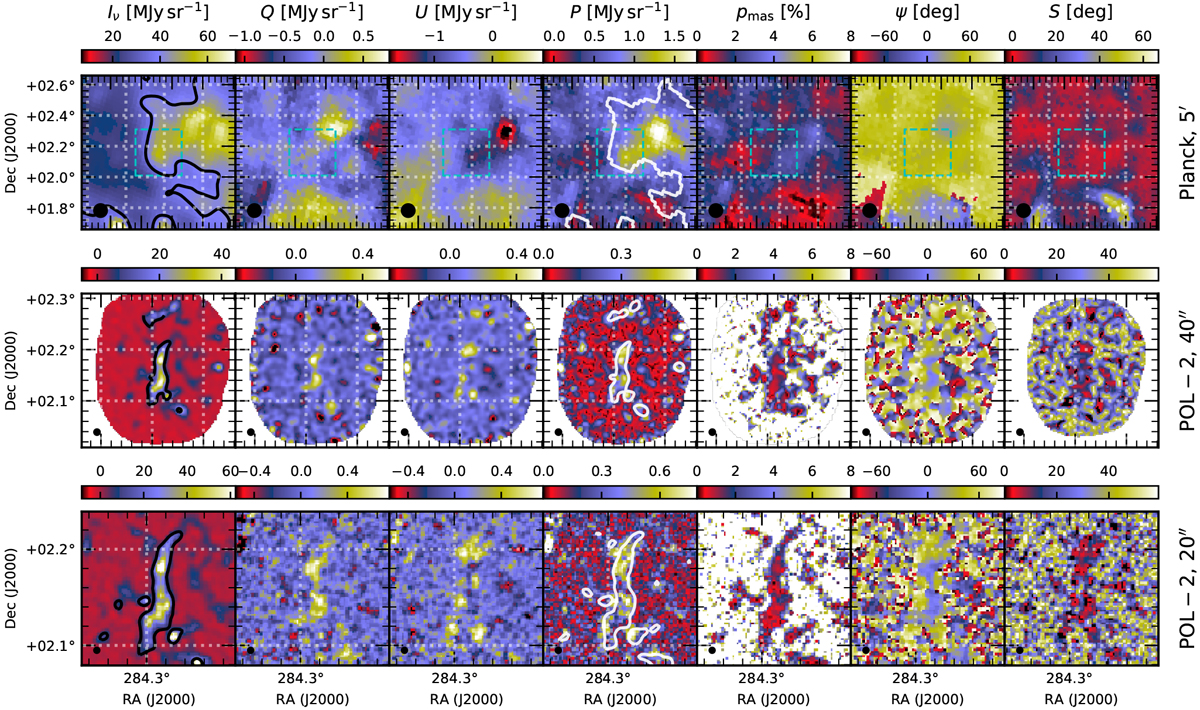
Overview of polarisation data of the G035.39-00.33 region. The three rows show, respectively, Planck data at 5′ resolution, POL-2 data at 40′′ resolution, and POL-2 data at 20′′ resolution. The seven frames on each row are: I, Q, U, polarised intensity P, polarisation fraction pmas, polarisation angle ψ, and polarisation angle dispersion function S for a lag of δ = FWHM/2. The dashed boxes on Planck maps correspond to the size of the second row images. The column densities N(H2) = 1022 cm−2 (at the corresponding resolutions) are indicated with contours on the I maps. On the second and third rows, these are calculated from background-subtracted Herschel and SCUBA-2 data. The white contours on the P maps correspond to an intensity I(850μm) of 40 mJy sr−1 on the Planck map and 10 mJy sr−1 on the POL-2 maps.
Current usage metrics show cumulative count of Article Views (full-text article views including HTML views, PDF and ePub downloads, according to the available data) and Abstracts Views on Vision4Press platform.
Data correspond to usage on the plateform after 2015. The current usage metrics is available 48-96 hours after online publication and is updated daily on week days.
Initial download of the metrics may take a while.