Fig. 7
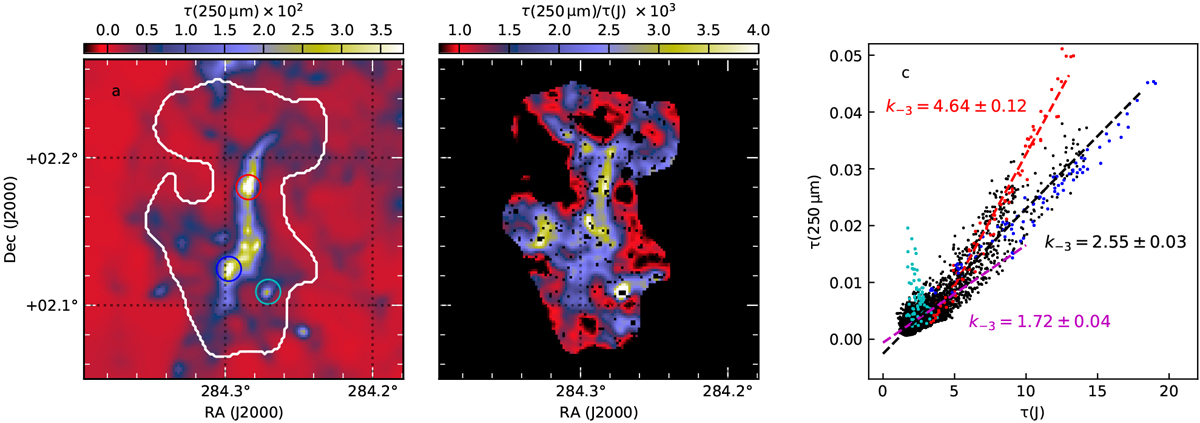
Comparison of τ (250 μm) and τ (J) estimates: the τ (250 μm) map (panel a), the ratio k−3 = 10−3 × τ (250 μm)∕τ (J) (panel b), and the same ratio as a correlation plot (panel c). The last two panels are limited to data in the area indicated in the first panel, also excluding pixels for which τ (J) is not defined because of masked stars. Selected 30′′ radius regions (see panel a) are marked in panel c with different colours: a point source SE of the southern clump (cyan) and the northern and southern τ (250 μm) peaks (red and blue circles, respectively). The black line in panel c is a least squares fit to the data, only excluding the SE point source. Fits to the northern clump and to data τ (J) <6 are shown in red and magenta, respectively.
Current usage metrics show cumulative count of Article Views (full-text article views including HTML views, PDF and ePub downloads, according to the available data) and Abstracts Views on Vision4Press platform.
Data correspond to usage on the plateform after 2015. The current usage metrics is available 48-96 hours after online publication and is updated daily on week days.
Initial download of the metrics may take a while.