Fig. 5
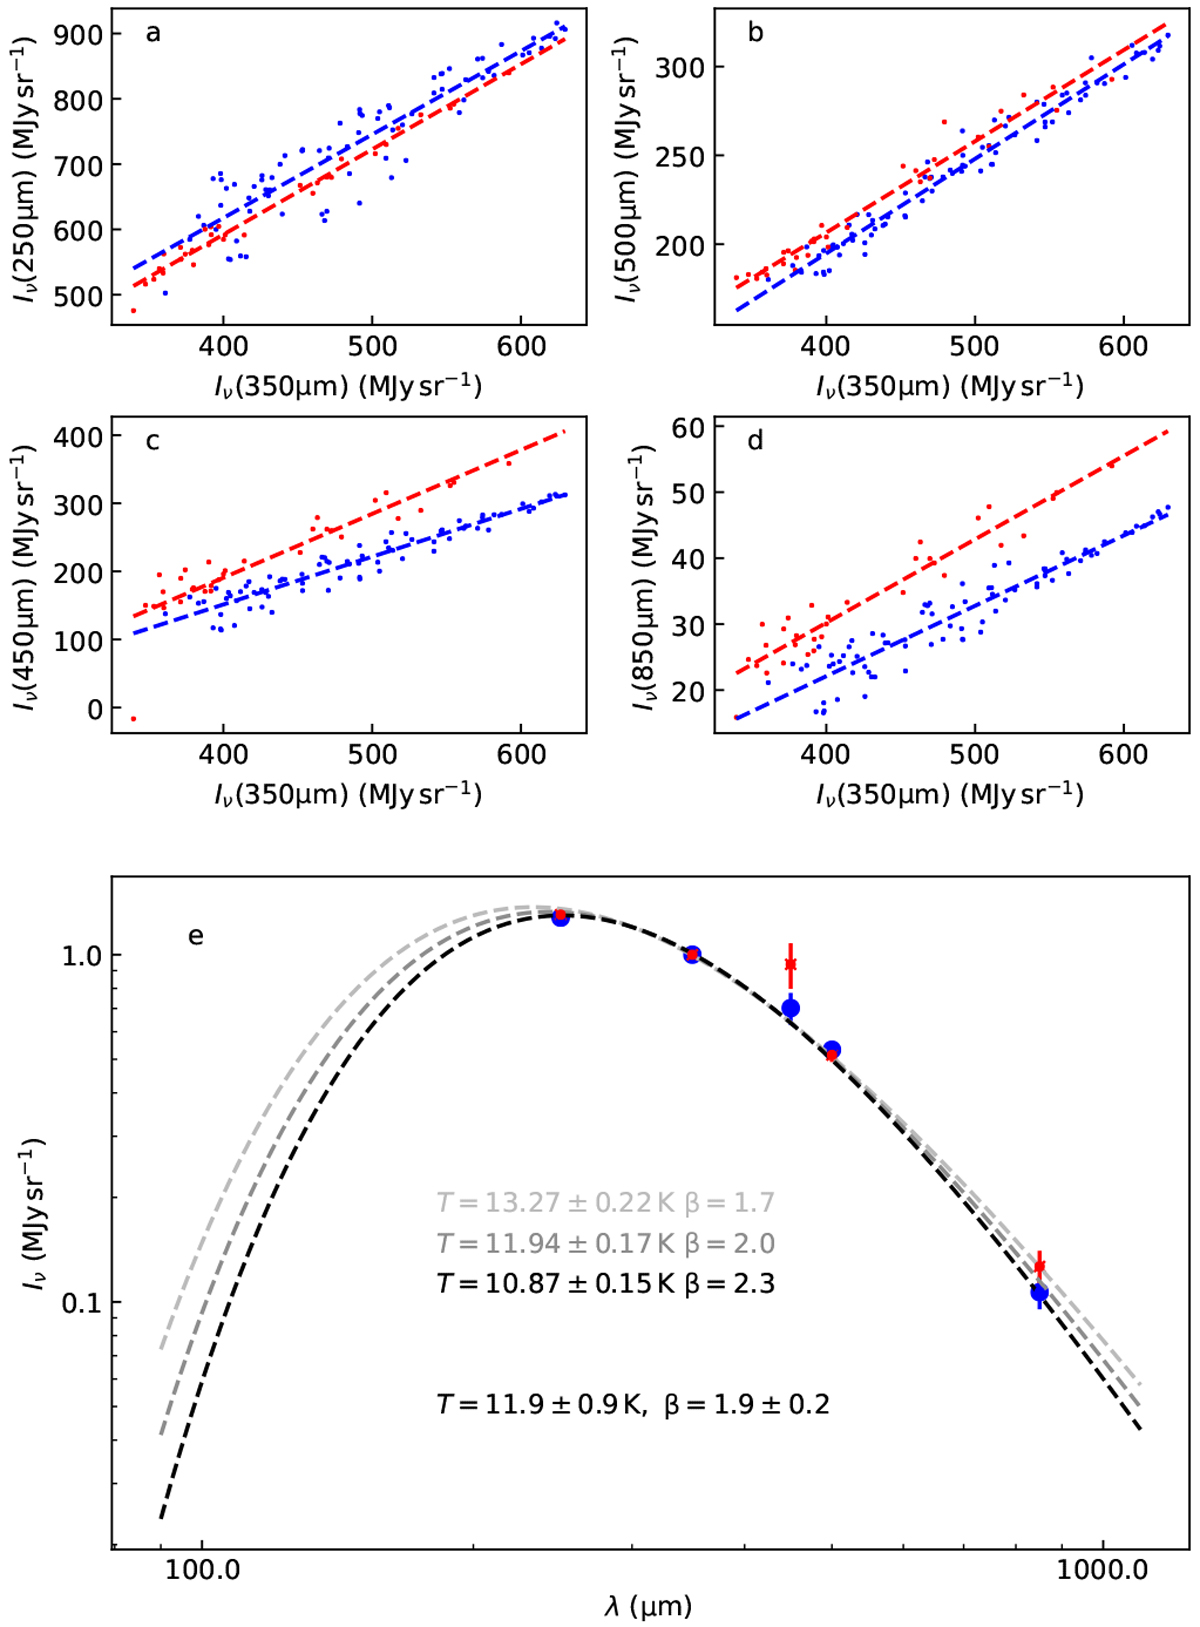
SEDs from the correlations of surface brightness values over the main filament. Panels a–d show the band-to-band correlations for the northern (red) and southern (blue) parts of the filaments. The points correspond to an oversampling by a factor of 2 relative to the data resolution. Panel e shows the resulting SEDs and modified black-body fits to the combined data for three fixed values of the spectral index β. The result for a fit with free β are shown below the results of the fixed-β fits.
Current usage metrics show cumulative count of Article Views (full-text article views including HTML views, PDF and ePub downloads, according to the available data) and Abstracts Views on Vision4Press platform.
Data correspond to usage on the plateform after 2015. The current usage metrics is available 48-96 hours after online publication and is updated daily on week days.
Initial download of the metrics may take a while.