Fig. 4
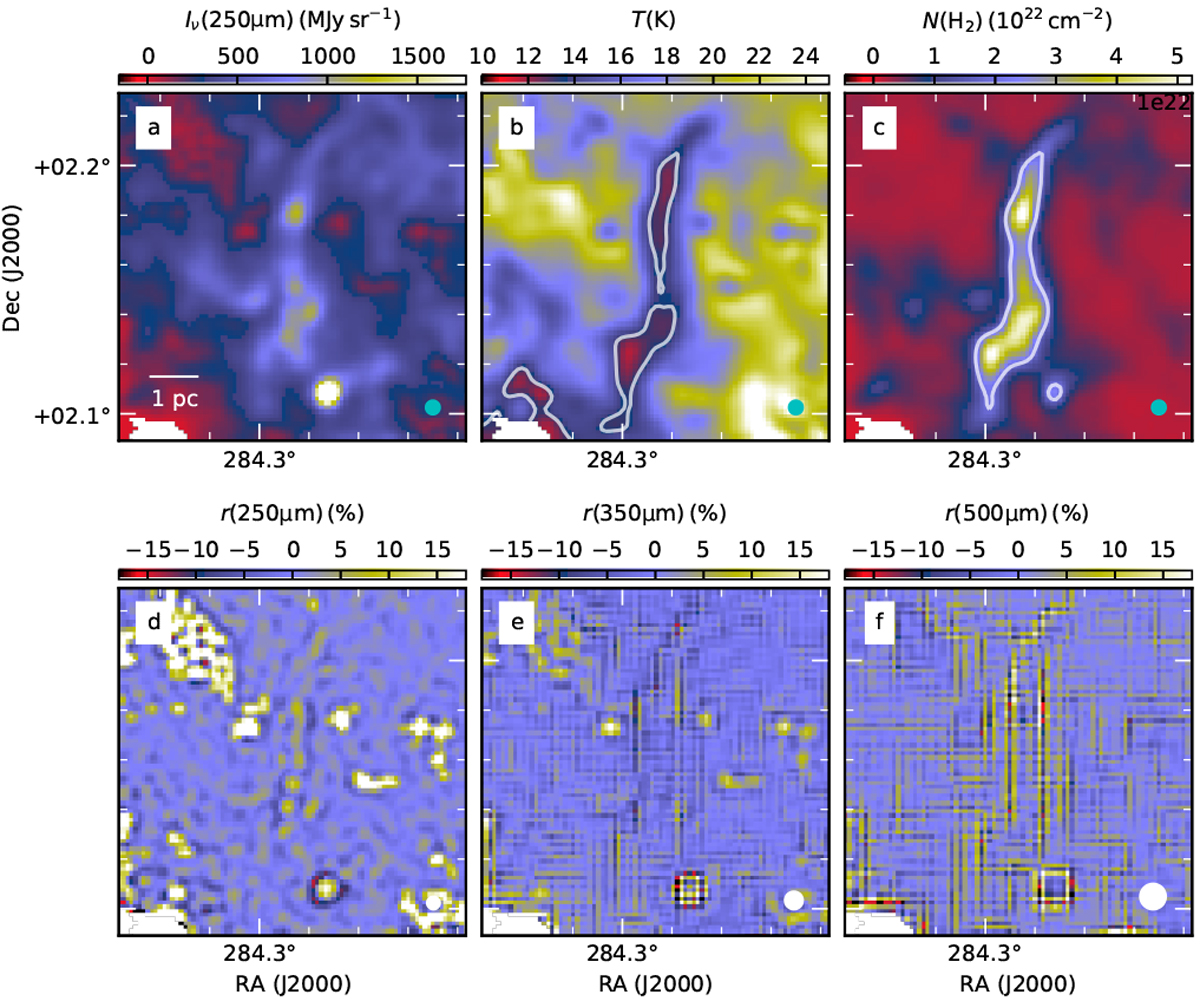
Results of modified black-body fits to SPIRE data at a resolution of 20′′. The upper panels show the fitted 250 μm intensity, dust colour temperature, and column density. The lower panels show the relative error of the fits for the individual SPIRE bands. We have masked a region in the SE corner where the background-subtracted 250 μm intensities are below 10 mJy sr−1. The beam sizes of the observations are shown in the bottom right-hand corner of each panel. The contours are drawn at T = 13.5 K and N(H2) = 2 × 1022 cm−2.
Current usage metrics show cumulative count of Article Views (full-text article views including HTML views, PDF and ePub downloads, according to the available data) and Abstracts Views on Vision4Press platform.
Data correspond to usage on the plateform after 2015. The current usage metrics is available 48-96 hours after online publication and is updated daily on week days.
Initial download of the metrics may take a while.