Fig. D.1
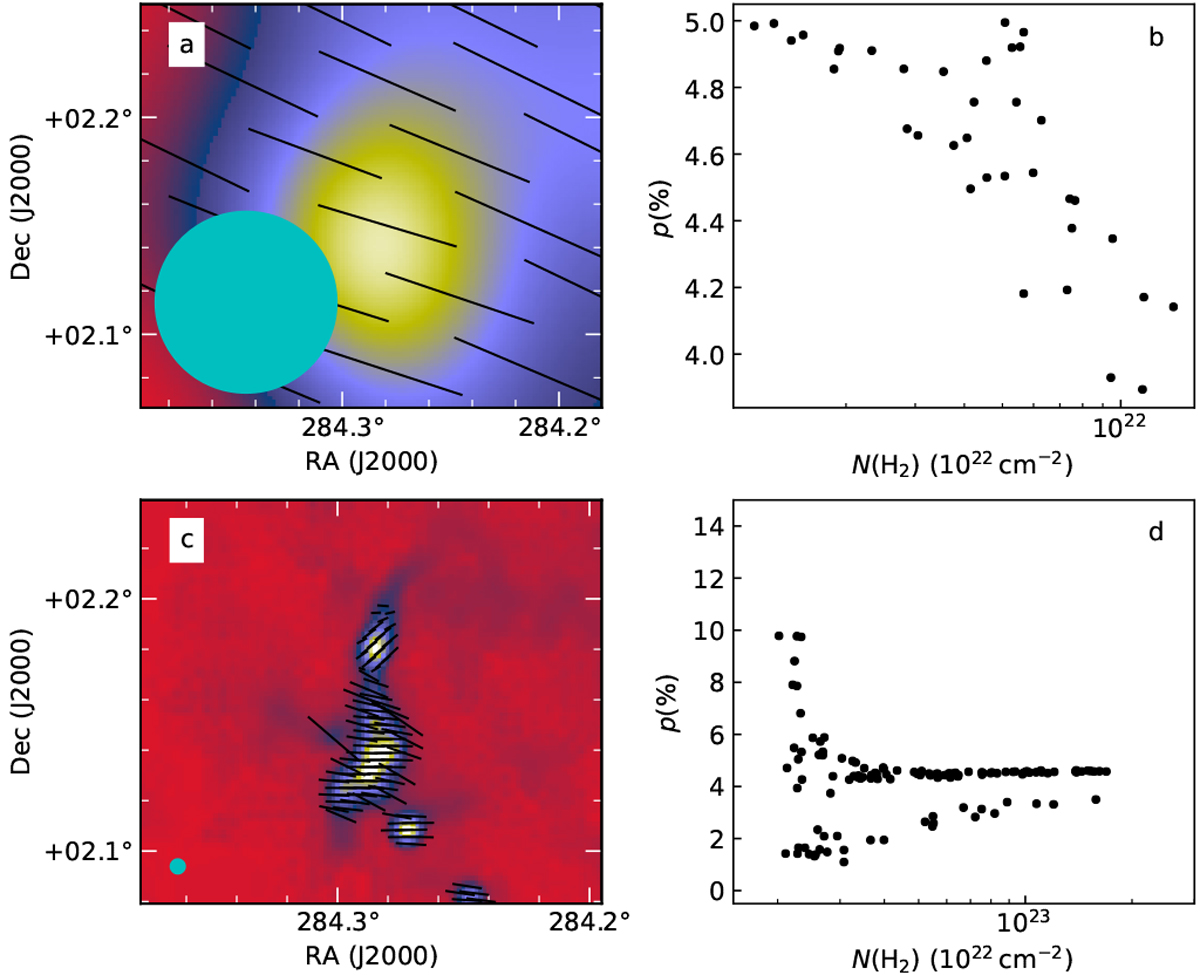
Predictions of polarised emission for a RT model with constant grain alignment, using the toy magnetic field model. The figure is the same as in Fig. 18 except that the transition from the large-scale field to different field orientations in the filament takes place at a higher threshold of n(H2) = 104 cm−3. The polarisation vectors are shown on the column density map in panel a and the p vs. N(H2) relation is plotted in panel b at Planck resolution. The lower panels are the corresponding plots for synthetic POL-2 observations.
Current usage metrics show cumulative count of Article Views (full-text article views including HTML views, PDF and ePub downloads, according to the available data) and Abstracts Views on Vision4Press platform.
Data correspond to usage on the plateform after 2015. The current usage metrics is available 48-96 hours after online publication and is updated daily on week days.
Initial download of the metrics may take a while.