Fig. C.5
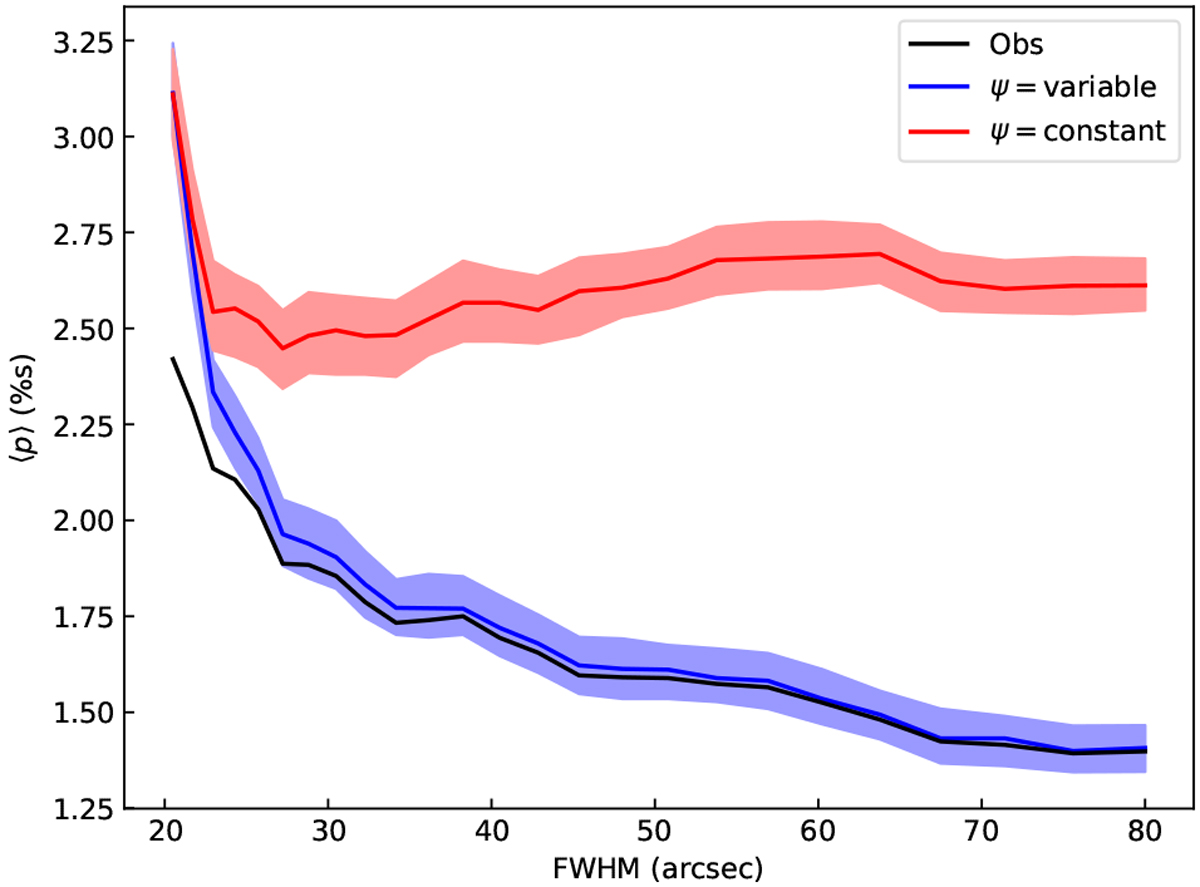
Simulation of ⟨p⟩ for POL-2 data with N(H2) > 1022 cm−2 as a functionof the resolution. The black line shows the relation for the original observations. The blue line corresponds to a case where (Q, U) observed at 20′′ resolutionare taken as a model of the true signal, before adding observational noise and convolving to a lower resolution. The red curve shows the result for data with identical p and I but with a globally constant polarisation angle. The shaded regions show the [10%, 90%] ranges for the random realisations.
Current usage metrics show cumulative count of Article Views (full-text article views including HTML views, PDF and ePub downloads, according to the available data) and Abstracts Views on Vision4Press platform.
Data correspond to usage on the plateform after 2015. The current usage metrics is available 48-96 hours after online publication and is updated daily on week days.
Initial download of the metrics may take a while.