Fig. C.4
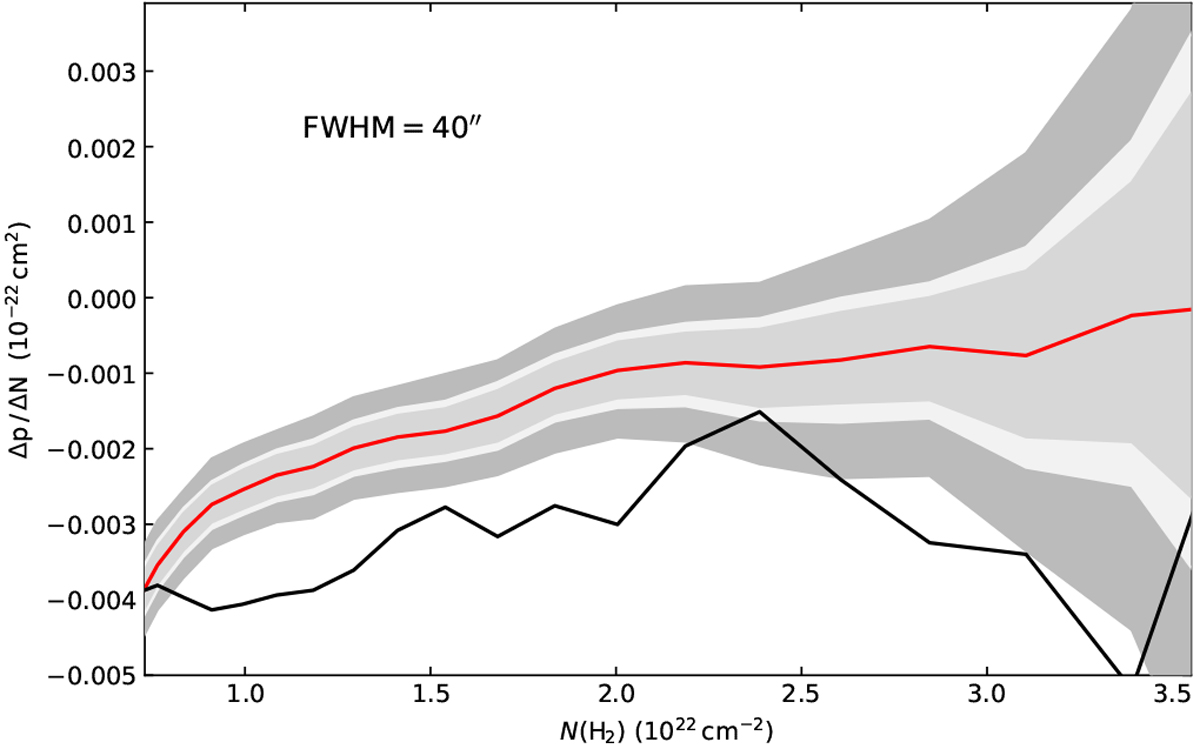
Simulation of pmas vs. N relation for POL-2 data. The figure shows the slopes of the fitted least squares lines as a function of the column density threshold used to select data. The black line shows the fits to the original observations. The red curve shows the median slope for simulations that assume an intrinsically constant polarisation fraction of p = 1.5% and the shaded areas correspond to [1%, 99%], [10%, 90%], and [16%, 84%] confidence intervals.
Current usage metrics show cumulative count of Article Views (full-text article views including HTML views, PDF and ePub downloads, according to the available data) and Abstracts Views on Vision4Press platform.
Data correspond to usage on the plateform after 2015. The current usage metrics is available 48-96 hours after online publication and is updated daily on week days.
Initial download of the metrics may take a while.