Fig. C.2
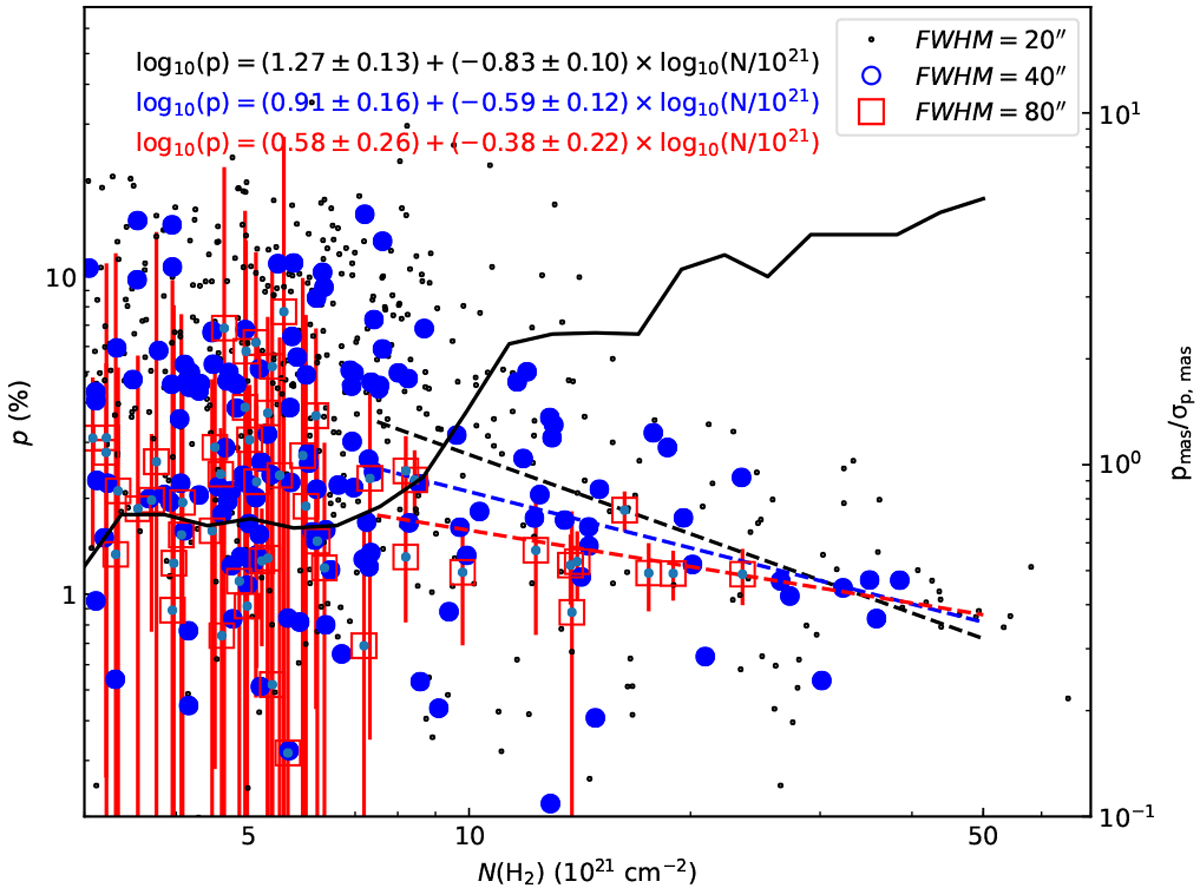
Polarisation fraction pmas as a functionof column density, based on POL-2 data at 20′′, 40′′, and 80′′ resolution. The data are sampled at half-beam steps. The dashed lines correspond to least squares fits data N(H2)> 7.5 × 1021 cm−2. The error bars are shown only for the FWHM = 80′′ data points. The solid black line and the right-hand y-axis show the median S/N for polarisation fraction, pmas∕σp,mas, at 40′′ resolution.
Current usage metrics show cumulative count of Article Views (full-text article views including HTML views, PDF and ePub downloads, according to the available data) and Abstracts Views on Vision4Press platform.
Data correspond to usage on the plateform after 2015. The current usage metrics is available 48-96 hours after online publication and is updated daily on week days.
Initial download of the metrics may take a while.