Fig. B.1
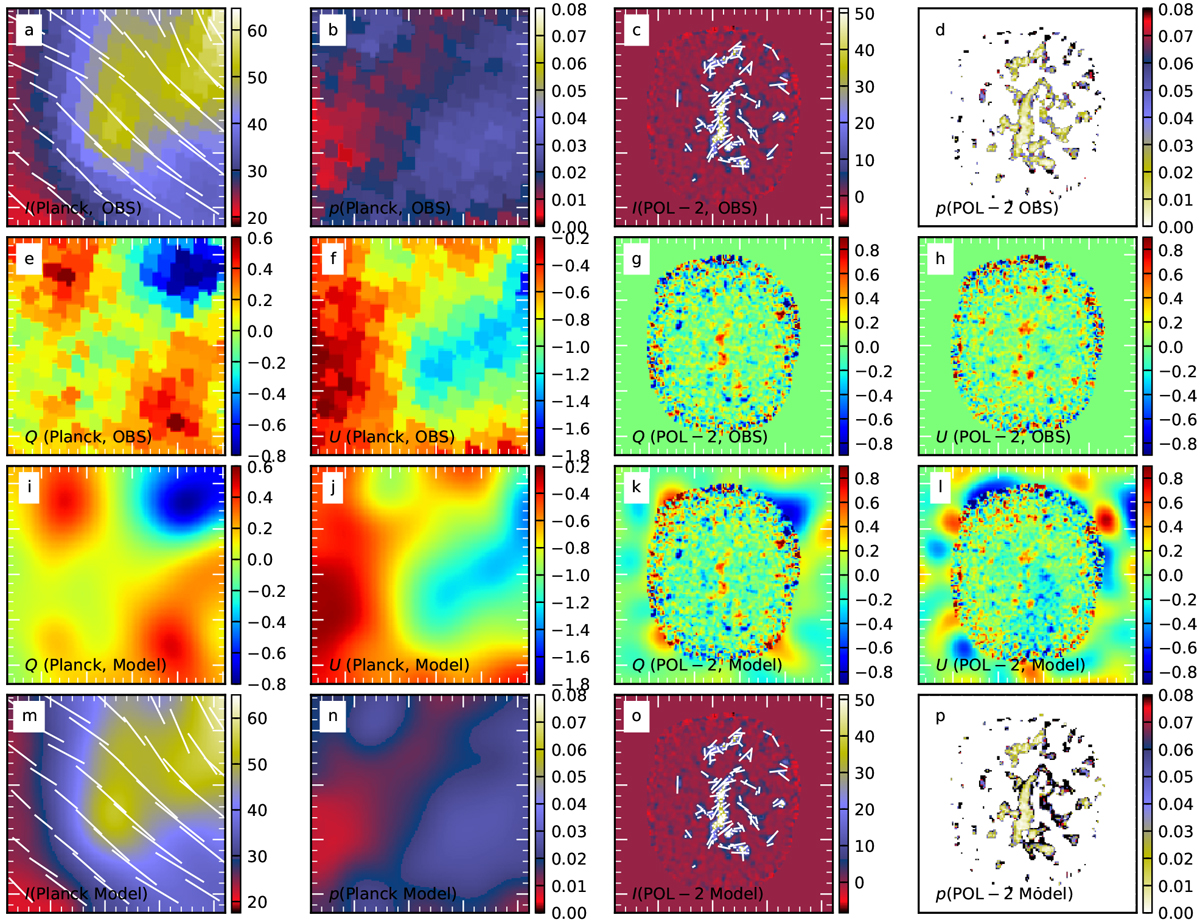
Results for the combined (I, Q, U) fir to Planck and POL-2 data. Panels a–d show the observed Planck and POL-2 surface brightness data and polarisation fraction maps. Panels a and c: the polarisation vectors based on observations. The second row shows the observed Planck and POL-2 maps of Q and U. The third and fourth rows show the (I, Q, U) maps of the fitted model. In panels c and o polarisation vectors are drawn only in regions with I (850 μm) > 5 mJy sr−1.
Current usage metrics show cumulative count of Article Views (full-text article views including HTML views, PDF and ePub downloads, according to the available data) and Abstracts Views on Vision4Press platform.
Data correspond to usage on the plateform after 2015. The current usage metrics is available 48-96 hours after online publication and is updated daily on week days.
Initial download of the metrics may take a while.