Fig. A.3
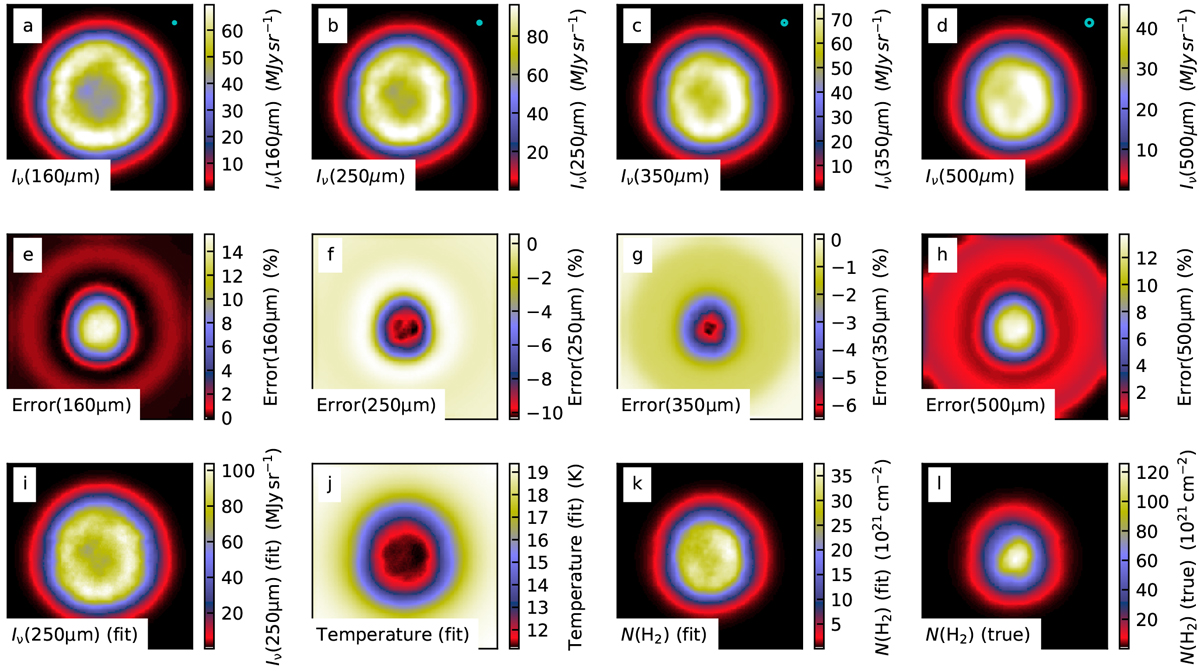
Fit of the simulated observations of the high-column-density model without observational noise. The first row shows the synthetic surface brightness maps with the beam size indicated in the upper right corner. The second row shows the relative fit residuals. Panels i and j show the fitted model parameters, the 250 μm surface brightness and the colour temperature. Panels k and l compare the final column density map at 10′′ resolution to the true column density.
Current usage metrics show cumulative count of Article Views (full-text article views including HTML views, PDF and ePub downloads, according to the available data) and Abstracts Views on Vision4Press platform.
Data correspond to usage on the plateform after 2015. The current usage metrics is available 48-96 hours after online publication and is updated daily on week days.
Initial download of the metrics may take a while.