Fig. A.1
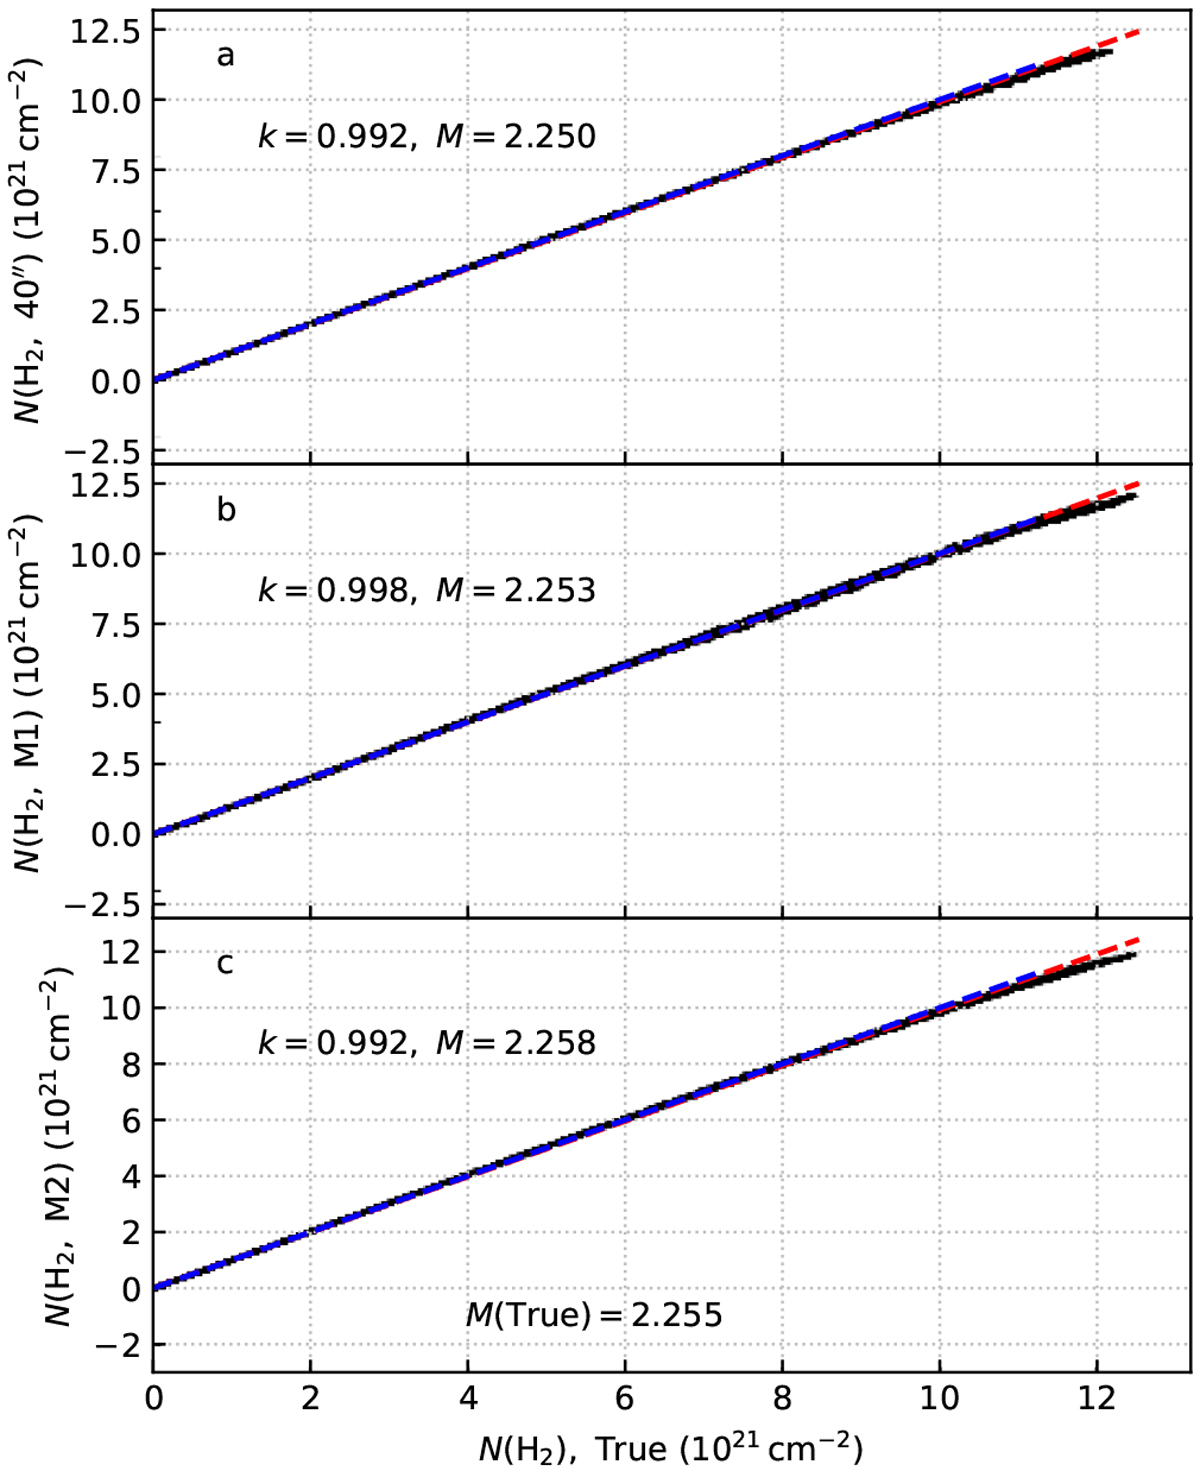
Correlations of column density estimates for the externally heated, lower column density model. The x-axis is the true column density of the model cloud at the resolution of 40′′ (panel a) or 18′′ (panels b and c). On the y-axes are the results from direct MBB fits at 40′′ resolution (panel a) and from methods A and B at 18′′ resolution (panels b and c, respectively). The dashed blue lines show the one-to-one relations and the dashed red lines the least squaresfits. The slopes k of the least squares lines as well as the estimated cloud masses (in solar masses) are given in the panels. The true mass of the cloud is quoted in panel c.
Current usage metrics show cumulative count of Article Views (full-text article views including HTML views, PDF and ePub downloads, according to the available data) and Abstracts Views on Vision4Press platform.
Data correspond to usage on the plateform after 2015. The current usage metrics is available 48-96 hours after online publication and is updated daily on week days.
Initial download of the metrics may take a while.