Fig. 24
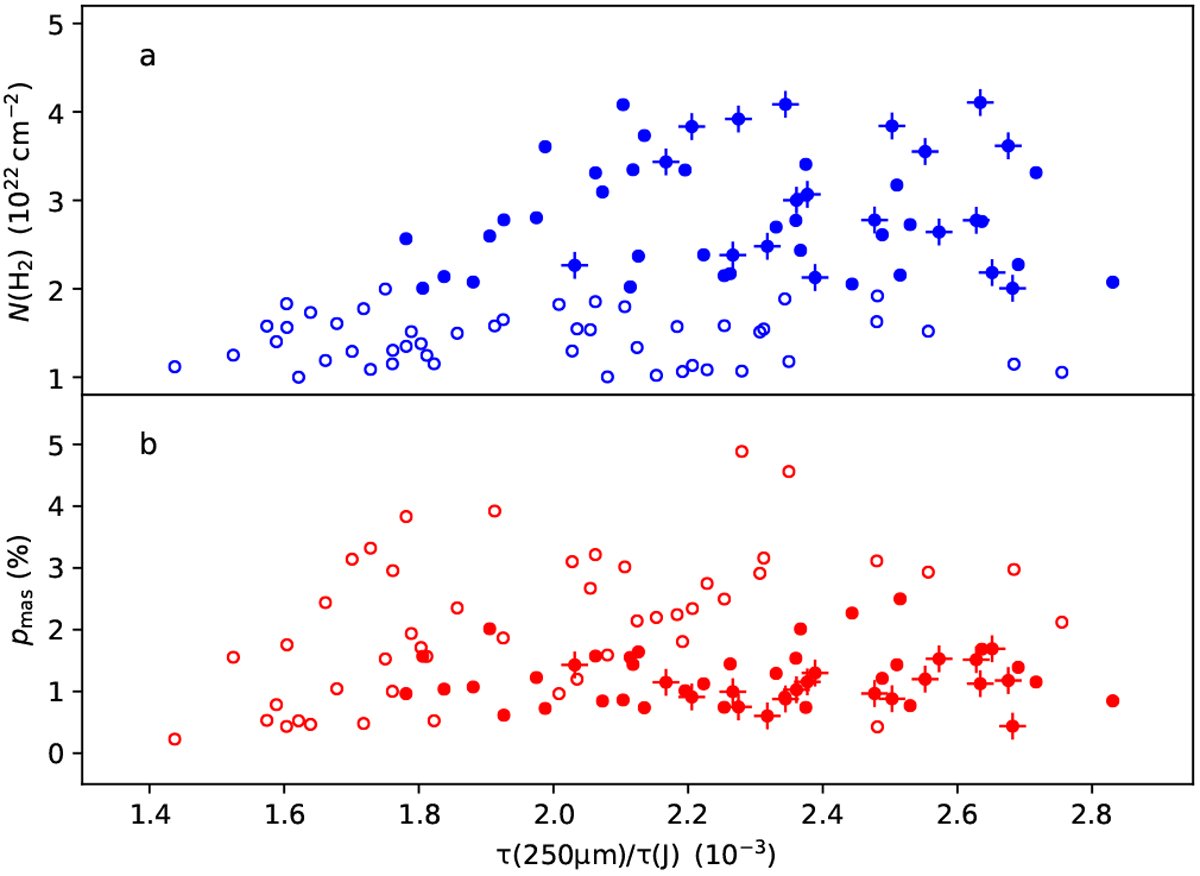
Correlations between opacity ratio τ (250 μ)∕τ (J) and column density (panel a) or POL-2 polarisation fraction (panel b). The data are at 40′′ resolution and sampled at half-beam steps. The points coinciding with the point sources marked in Fig. 14 are marked with plus signs. Data for column densities N(H2)< 2 × 1022 cm−2 are plotted with open symbols and for these the pmas estimates may be inaccurate.
Current usage metrics show cumulative count of Article Views (full-text article views including HTML views, PDF and ePub downloads, according to the available data) and Abstracts Views on Vision4Press platform.
Data correspond to usage on the plateform after 2015. The current usage metrics is available 48-96 hours after online publication and is updated daily on week days.
Initial download of the metrics may take a while.