Fig. 21
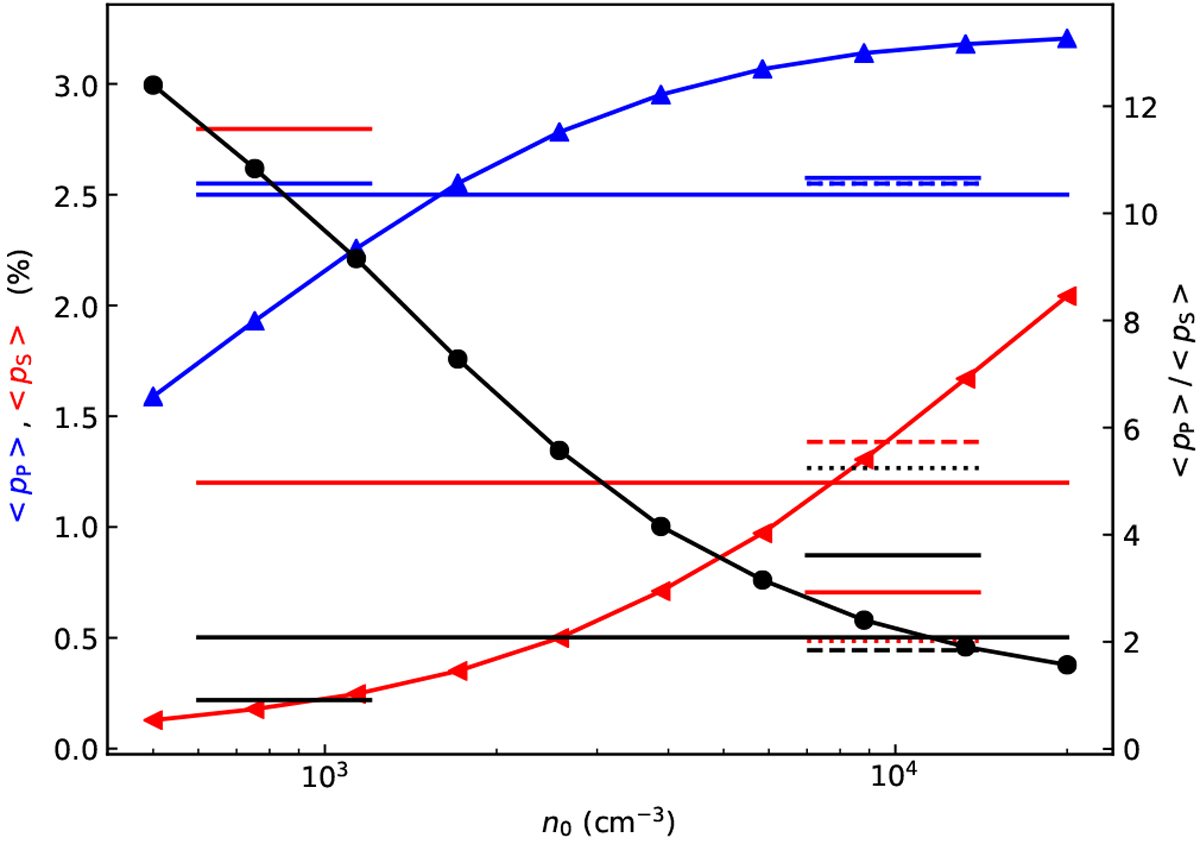
Polarisation fractions for different grain alignment models. The long horizontal lines show the observed average values of p (left y-axis) for the Planck (pP, blue line) and the POL-2 (pS, red line) observations. The black long horizontal line stands for the observed ⟨pP ⟩∕⟨pS⟩ ratio (right y-axis). The three curves with markers show the corresponding quantities for models that assume a loss of grain alignment above the density threshold n0. The results for models with constant grain alignment are indicated with short horizontal lines near n = 103 cm−3. The RAT models are shown as short horizontal lines near n = 104 cm−3, for the default model (solid lines), for the case with larger grain sizes (dashed line), and for an alternative model with a smaller τ (250 μm)∕τ (J) ratio (dotted line).
Current usage metrics show cumulative count of Article Views (full-text article views including HTML views, PDF and ePub downloads, according to the available data) and Abstracts Views on Vision4Press platform.
Data correspond to usage on the plateform after 2015. The current usage metrics is available 48-96 hours after online publication and is updated daily on week days.
Initial download of the metrics may take a while.