Fig. 18
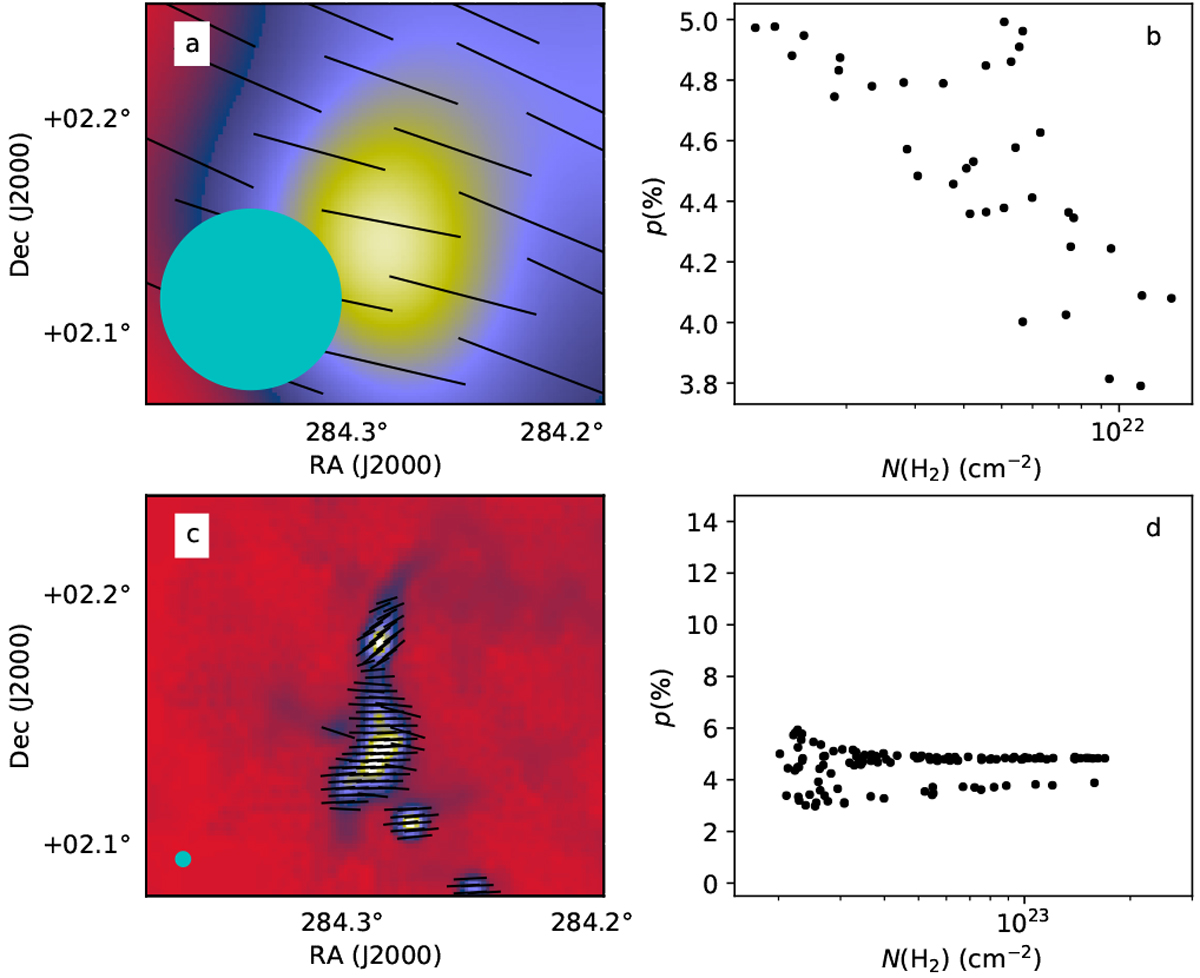
Predictions of the toy magnetic field model with constant grain alignment. The polarisation vectors are shown on the column density map in panel a (central part of the full map) and the p vs. N(H2) relation is plotted in panel b at Planck resolution. The lower panels are the same for synthetic POL-2 observations, at a resolution of 20′′, assuming high-pass filtering with θ = 200′′. The scaling of the absolute p values is arbitrary but identical between the panels.
Current usage metrics show cumulative count of Article Views (full-text article views including HTML views, PDF and ePub downloads, according to the available data) and Abstracts Views on Vision4Press platform.
Data correspond to usage on the plateform after 2015. The current usage metrics is available 48-96 hours after online publication and is updated daily on week days.
Initial download of the metrics may take a while.