Fig. 17
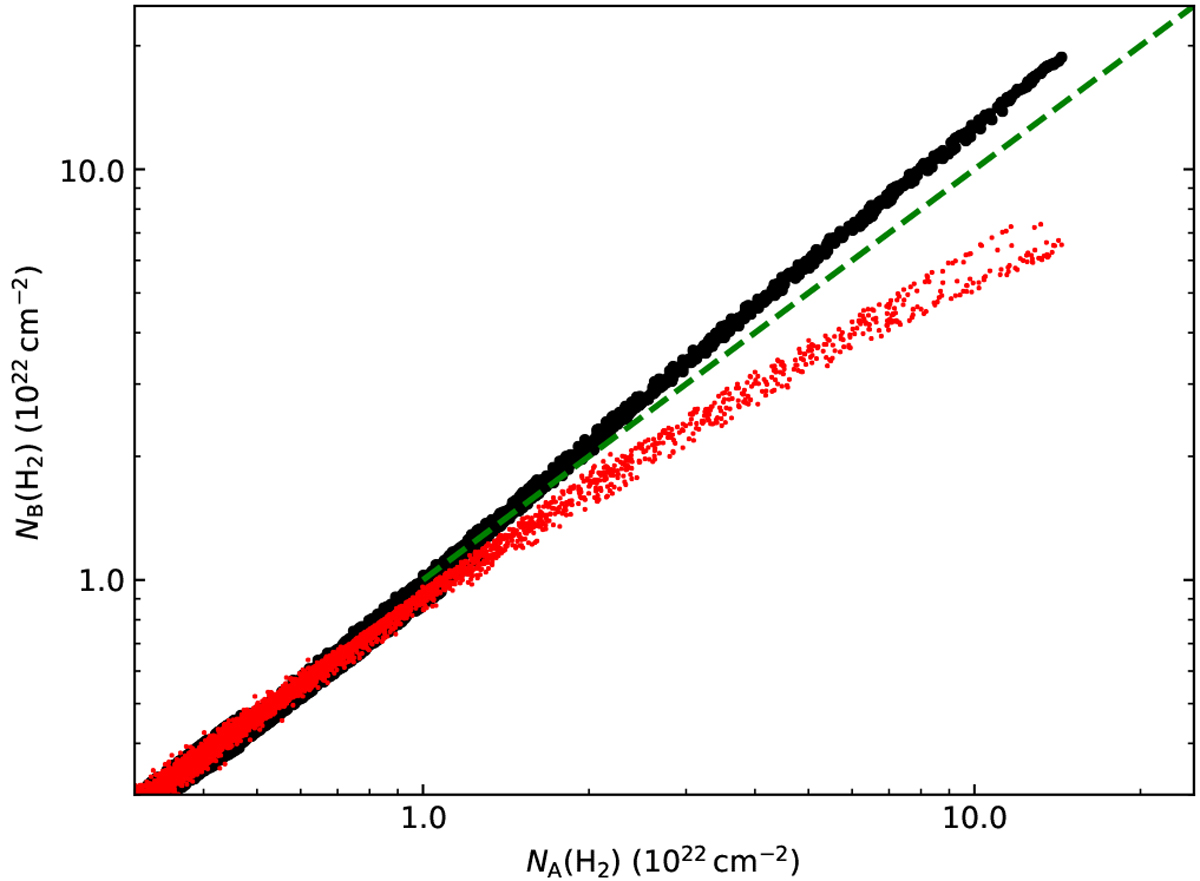
Correlation between the column densities N(H2) of two RT models fitted to observations. Column densities NA and NB (black dots) correspond to dust models with τ (250 μm)∕τ (J) equal to 1.6 × 10⁻³ and 1.0 × 10⁻³, respectively. For the RT model with column densities NA, the red points show the column density estimates derived from the synthetic surface brightness maps. The dashed line is the one-to-one relation. All data are at 20′′ resolution.
Current usage metrics show cumulative count of Article Views (full-text article views including HTML views, PDF and ePub downloads, according to the available data) and Abstracts Views on Vision4Press platform.
Data correspond to usage on the plateform after 2015. The current usage metrics is available 48-96 hours after online publication and is updated daily on week days.
Initial download of the metrics may take a while.