Free Access
Fig. 16
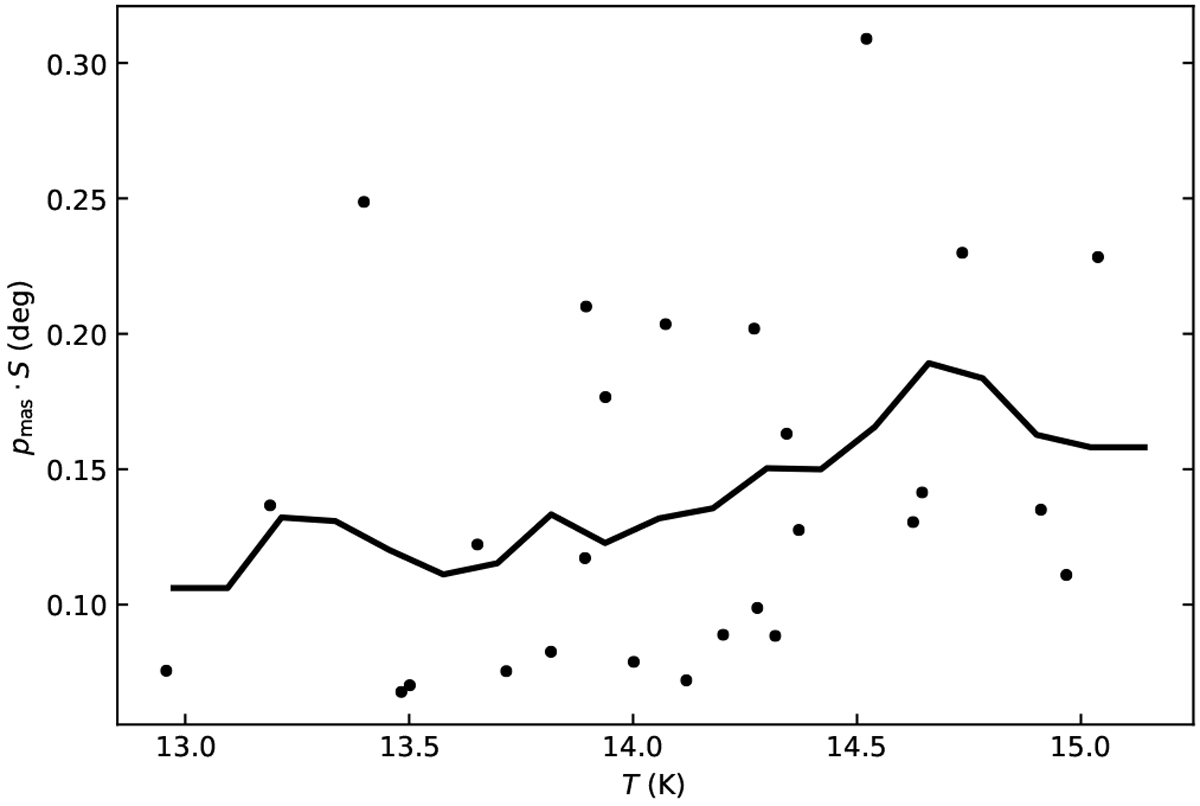
Product p × S as a functionof dust colour temperature. The data are at 40′′ resolution, sampled at half-beam steps, and selected from the region with N(H2) > 2 × 1022 cm−2. The solid line shows a moving average.
Current usage metrics show cumulative count of Article Views (full-text article views including HTML views, PDF and ePub downloads, according to the available data) and Abstracts Views on Vision4Press platform.
Data correspond to usage on the plateform after 2015. The current usage metrics is available 48-96 hours after online publication and is updated daily on week days.
Initial download of the metrics may take a while.