Fig. 15
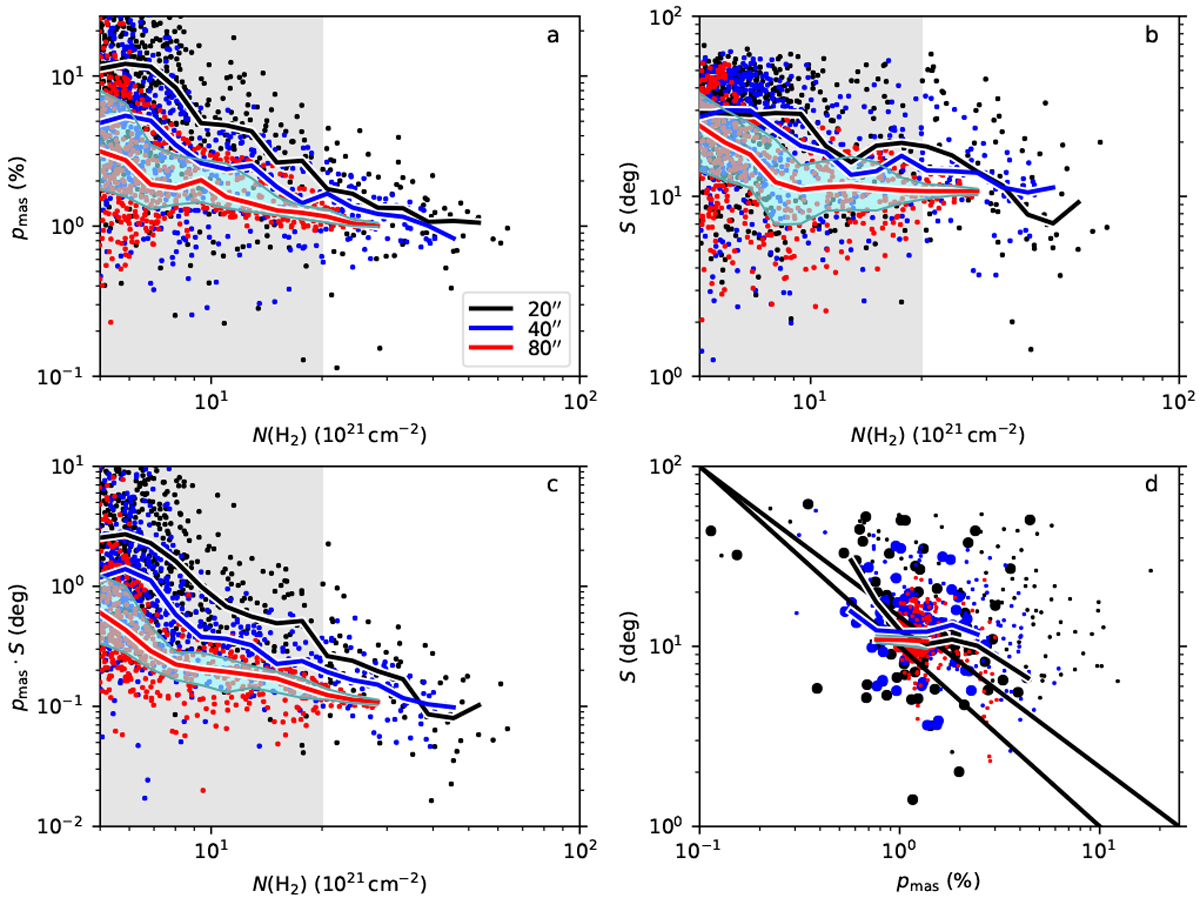
Correlations between POL-2 polarisation parameters pmas and S and thecolumn density. The quantities are calculated at four spatial resolutions represented with the colours indicated in panel a. The data are sampled at steps of FWHM/2 and the solid lines correspond to running averages. In panels a–d, the shading corresponds to N(H2)< 2 × 1022 cm−2 where, according to Fig. 9, the 40′′ resolution pmas estimates become unreliable. In panel d, values for 1022 cm−2 < N(H2) < 2 × 1022 cm−2 and N(H2) > 2 × 1022 cm−2 are shown with small and large symbols, respectively, and the lines show running averages for the higher column density interval (20 logarithmic bins over the parameter range with a minimum of four points per bin). Shaded cyan region corresponds to the interquartile range of the quantities plotted with red lines. In panel d the upper solid black line shows the relation log10 (S) = − 0.834 × log10(pmas) − 0.504 from Planck Collaboration Int. XIX (2015) and the lower black line the relation S = 0.1∕pmas.
Current usage metrics show cumulative count of Article Views (full-text article views including HTML views, PDF and ePub downloads, according to the available data) and Abstracts Views on Vision4Press platform.
Data correspond to usage on the plateform after 2015. The current usage metrics is available 48-96 hours after online publication and is updated daily on week days.
Initial download of the metrics may take a while.