Fig. 14
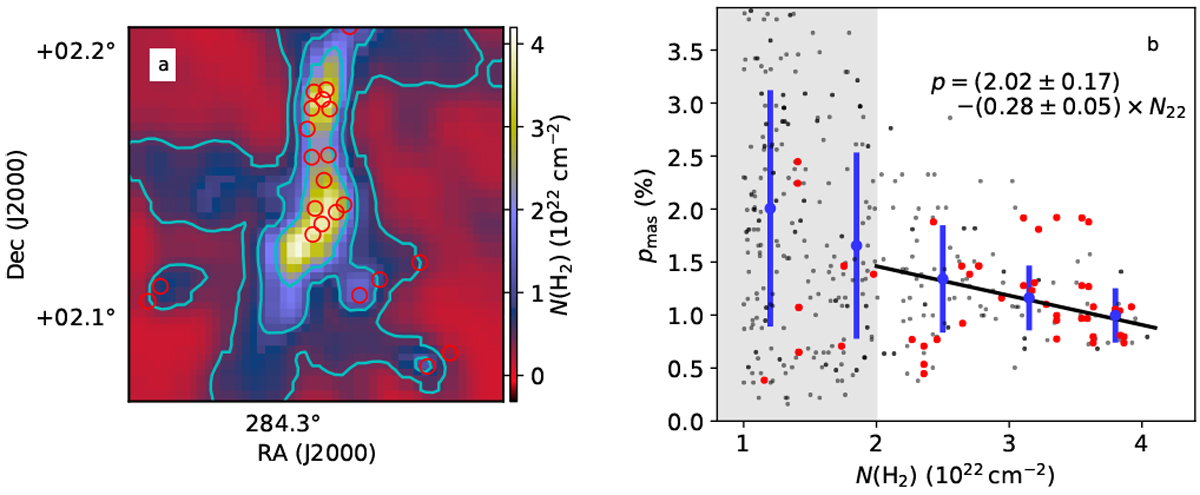
POL-2 polarisation fraction and column density. Panel a shows the column density map N5 (H2) at 40′′ resolution. The contours are drawn at 0.5, 1, and 2 times 1022 cm−2 and the red circles denote the locations of the point sources of Table 2. In panel b, pmas is plotted as a function of column density for data with N(H2) > 1022 cm−2. The pixels coinciding with point sources (red circles of panel a) are plotted in red. The blue bars are representative error estimates. The result of the weighted least squares fit to data at N(H2)> 2 × 1022 cm−2 is givenin the panel and is shown as a black solid line. The shading corresponds to N(H2)< 2 × 1022 cm−2 where the pmas estimates may be biased.
Current usage metrics show cumulative count of Article Views (full-text article views including HTML views, PDF and ePub downloads, according to the available data) and Abstracts Views on Vision4Press platform.
Data correspond to usage on the plateform after 2015. The current usage metrics is available 48-96 hours after online publication and is updated daily on week days.
Initial download of the metrics may take a while.