Fig. 13
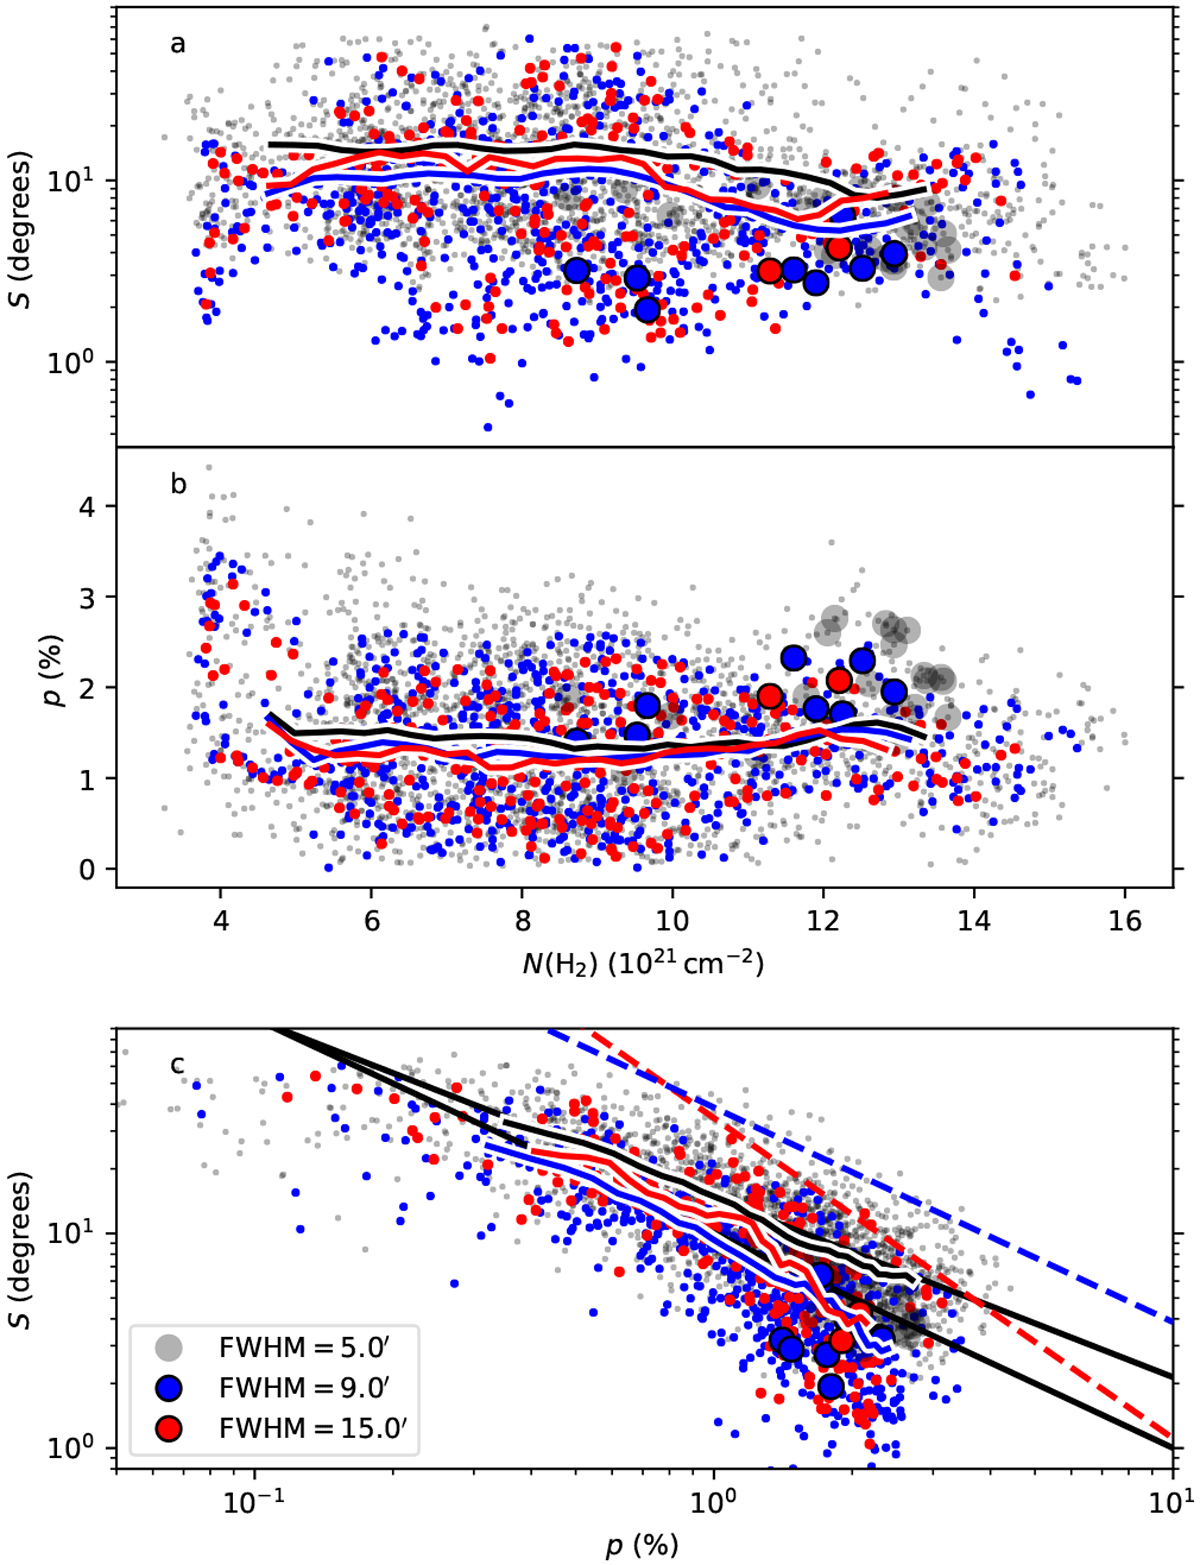
Polarisation angle dispersion function S and polarisation fraction pmas from Planck data in a 2° × 2° area centred on the POL-2 field. Panels a and b show these as a function of dust optical depth and panel c shows their mutual correlation. The colours of the plot symbols correspond to the data resolution, as indicated in panel c. The solid lines show the corresponding moving averages. The points inside the area mapped with POL-2 are plotted with large symbols. The data are sampled at steps of FWHM/2 and S is calculated for lag δ = FWHM/2. In panel c the upper solid black line shows the relation log10(S) = − 0.834 × log10(pmas) − 0.504 from Planck Collaboration Int. XIX (2015) and the lower black line the relation S = 0.1∕pmas. The red dashed line is the relation log pmas = − 0.670 log S − 0.97 from Fissel et al. (2016). The blue dashed line corresponds to the fit to Gould Belt cloud data, S × p = 0.31° (FWHM/160′)0.18 of Planck Collaboration XII (2018), calculated with FWHM = 9′.
Current usage metrics show cumulative count of Article Views (full-text article views including HTML views, PDF and ePub downloads, according to the available data) and Abstracts Views on Vision4Press platform.
Data correspond to usage on the plateform after 2015. The current usage metrics is available 48-96 hours after online publication and is updated daily on week days.
Initial download of the metrics may take a while.