Fig. 12
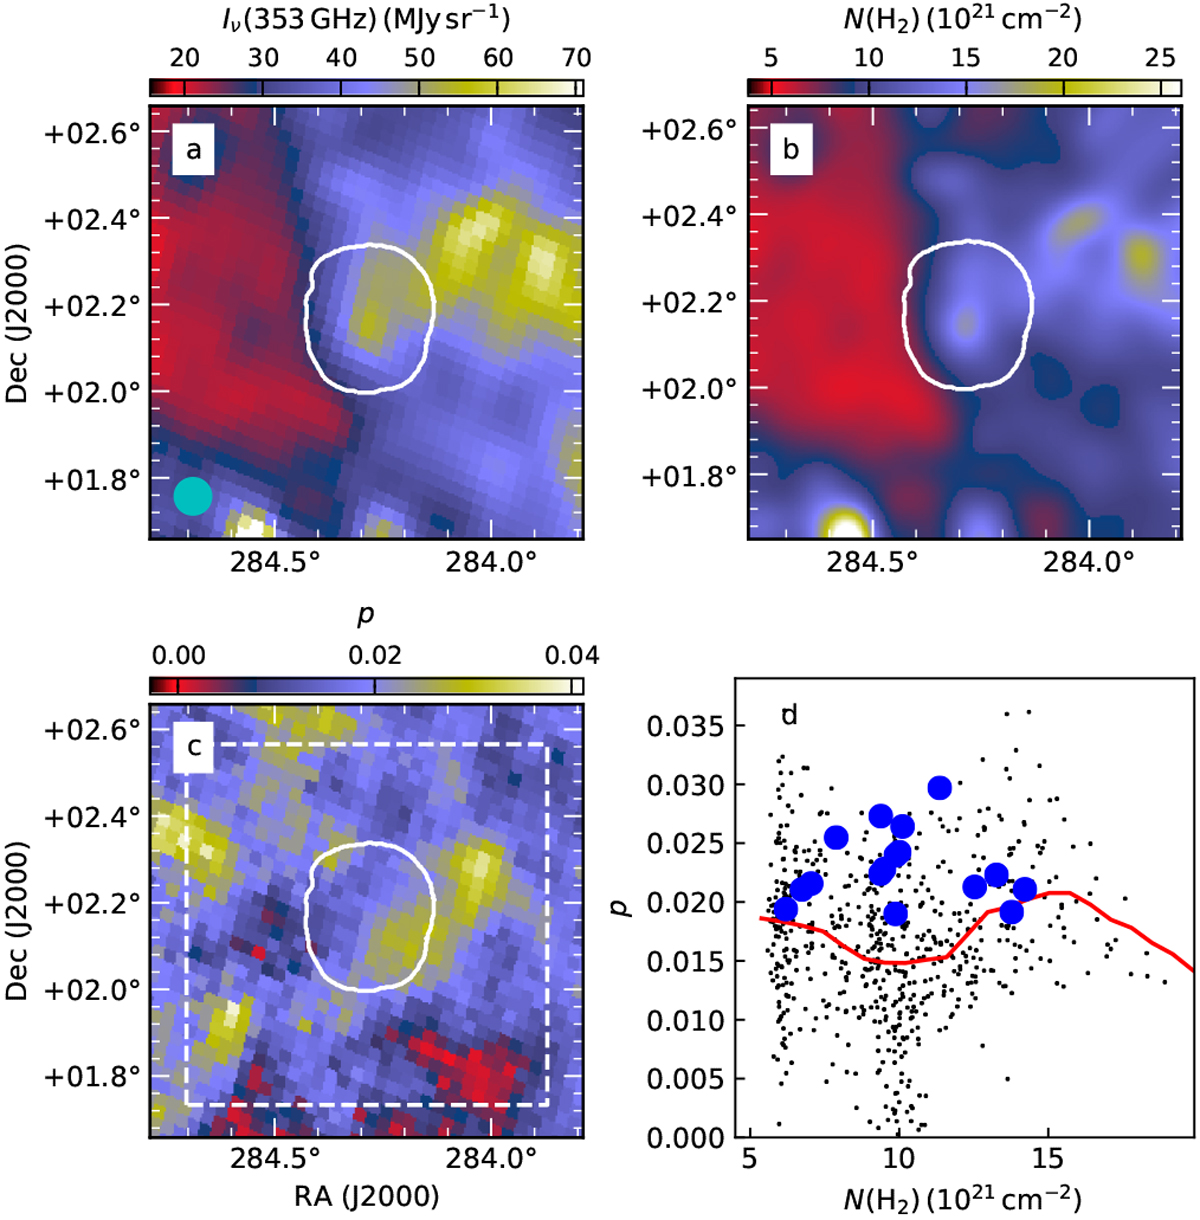
Polarisation fraction of the G035.39-00.33 region based on Planck data. Panel a shows the 850 μm surface brightness, panel b the Herschel column density map convolved to 5′ resolution, and panel c a map of the polarisation fraction pmas from Planck data. The white contour indicates the coverage of the SCUBA-2 map. Panel d shows the polarisation fraction as a function of column density, sampled with 2′ steps from maps at 5′ resolution, excluding the map boundaries (indicated by dashed lines in panel c), without a S/N cut-off. The red line is the running mean and the blue circles show values from the area covered by SCUBA-2 observations.
Current usage metrics show cumulative count of Article Views (full-text article views including HTML views, PDF and ePub downloads, according to the available data) and Abstracts Views on Vision4Press platform.
Data correspond to usage on the plateform after 2015. The current usage metrics is available 48-96 hours after online publication and is updated daily on week days.
Initial download of the metrics may take a while.