Fig. 1
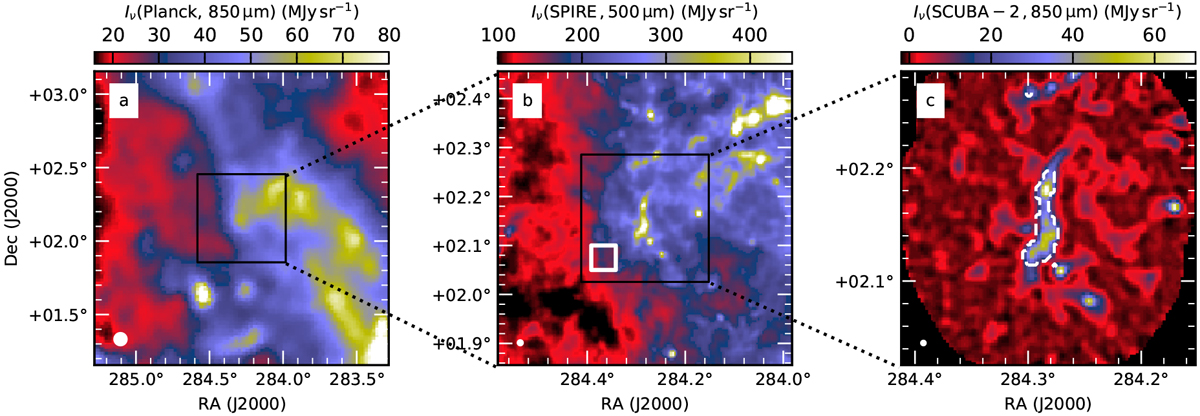
Planck 850 μm (353 GHz), Herschel 500 μm, and SCUBA-2/POL-2 850 μm surface brightness maps of the G035.39-00.33 filament and its surroundings. The beam sizes are indicated in the lower left corner of each panel (5′, 37′′, and 14′′, respectively). In panel b the white box indicates a reference region for background subtraction. The dashed contour in panel c is drawn atthe level of 180 mJy sr−1 of the background-subtracted 500 μm surface brightness.
Current usage metrics show cumulative count of Article Views (full-text article views including HTML views, PDF and ePub downloads, according to the available data) and Abstracts Views on Vision4Press platform.
Data correspond to usage on the plateform after 2015. The current usage metrics is available 48-96 hours after online publication and is updated daily on week days.
Initial download of the metrics may take a while.