Fig. 8.
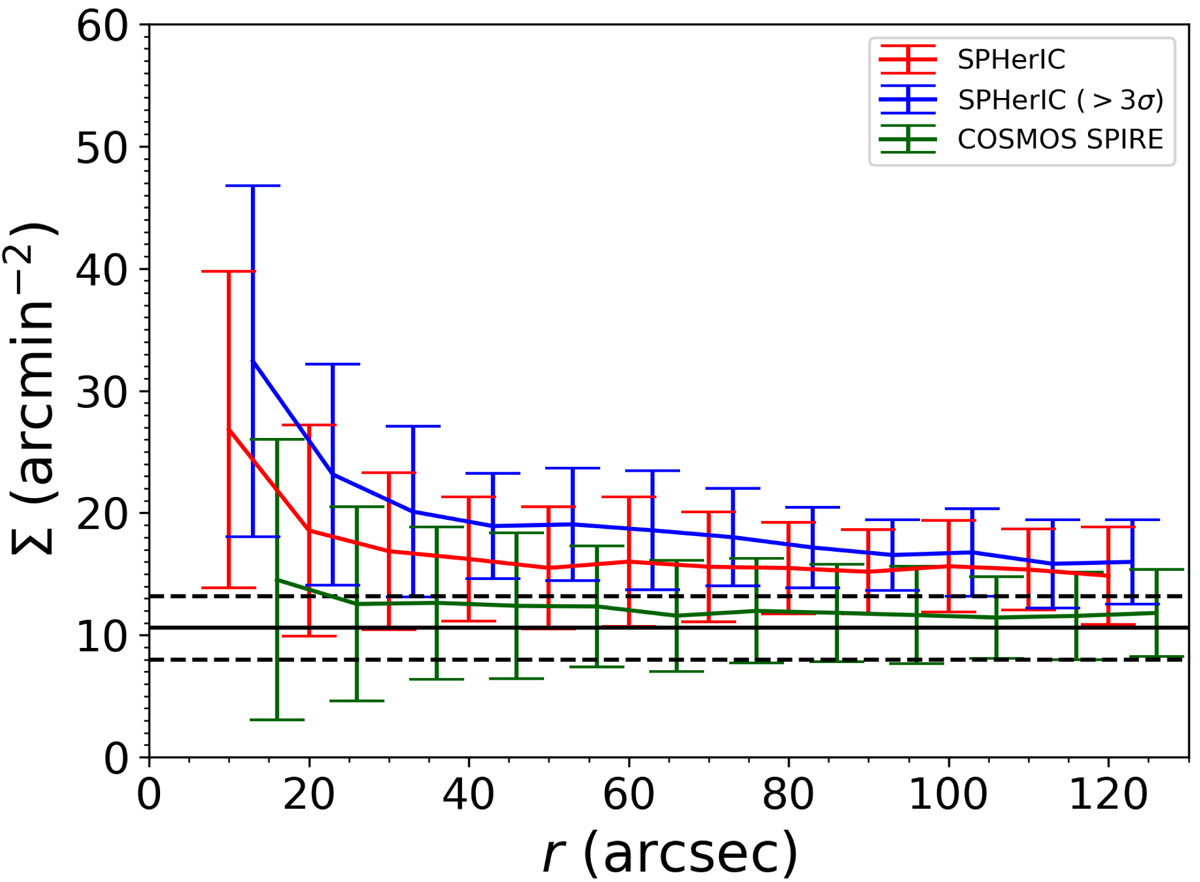
Surface densities of red IRAC sources estimated in annuli of width 10″ centered on the BRCGs. The stack for the entire SPHerIC sample (82 candidates) is indicated by the red line, while the blue line is for the densest candidates (with Σ60″ > ΣSpUDS + 3σ). In green we show the profile around red SPIRE sources in the COSMOS field. The solid black line indicates the mean surface density ΣSpUDS of IRAC red sources in the SpUDS survey, derived from a Gaussian fit as described in the text, while the dashed black lines indicate ΣSpUDS ± σSpUDS. Error bars indicate the scatter and not the error on the mean value. The blue and green lines are offset in angular separation for clarity.
Current usage metrics show cumulative count of Article Views (full-text article views including HTML views, PDF and ePub downloads, according to the available data) and Abstracts Views on Vision4Press platform.
Data correspond to usage on the plateform after 2015. The current usage metrics is available 48-96 hours after online publication and is updated daily on week days.
Initial download of the metrics may take a while.