Fig. 7.
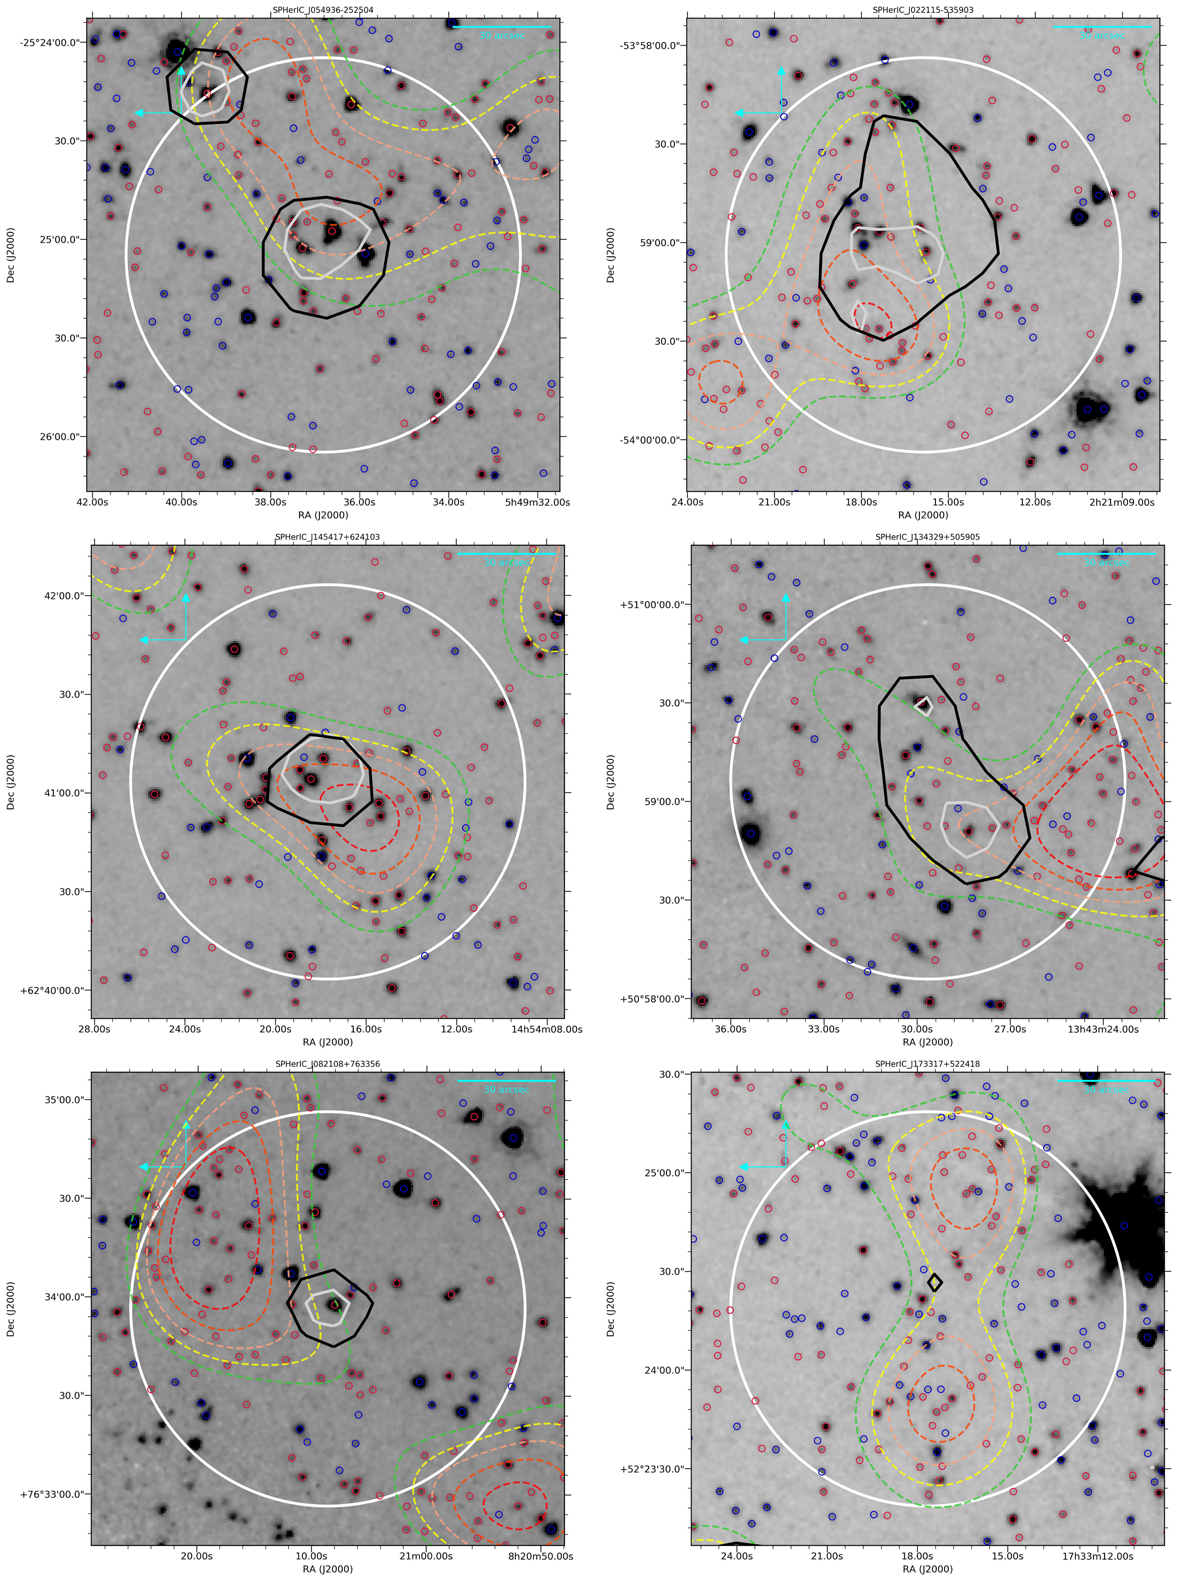
Images of the SPHerIC candidates at 4.5 μm which are 4σ overdense within a radius of 1′. Each image is ∼ 2.4′×2.4′. IRAC sources with [3.6]−[4.5] > (<) −0.1 are indicated by red (blue) circles. Contours of significance of the overdensities are shown green-yellow-salmon-orange-red lines starting at 2.5σ and incremented in 0.5σ steps. Herschel emission 3σ isocontours at 350 and 250 μm are shown as black and gray lines respectively. The large white circle has a radius of 1′ and is centered on the peak of emission at 350 μm from SPIRE.
Current usage metrics show cumulative count of Article Views (full-text article views including HTML views, PDF and ePub downloads, according to the available data) and Abstracts Views on Vision4Press platform.
Data correspond to usage on the plateform after 2015. The current usage metrics is available 48-96 hours after online publication and is updated daily on week days.
Initial download of the metrics may take a while.