Fig. 5.
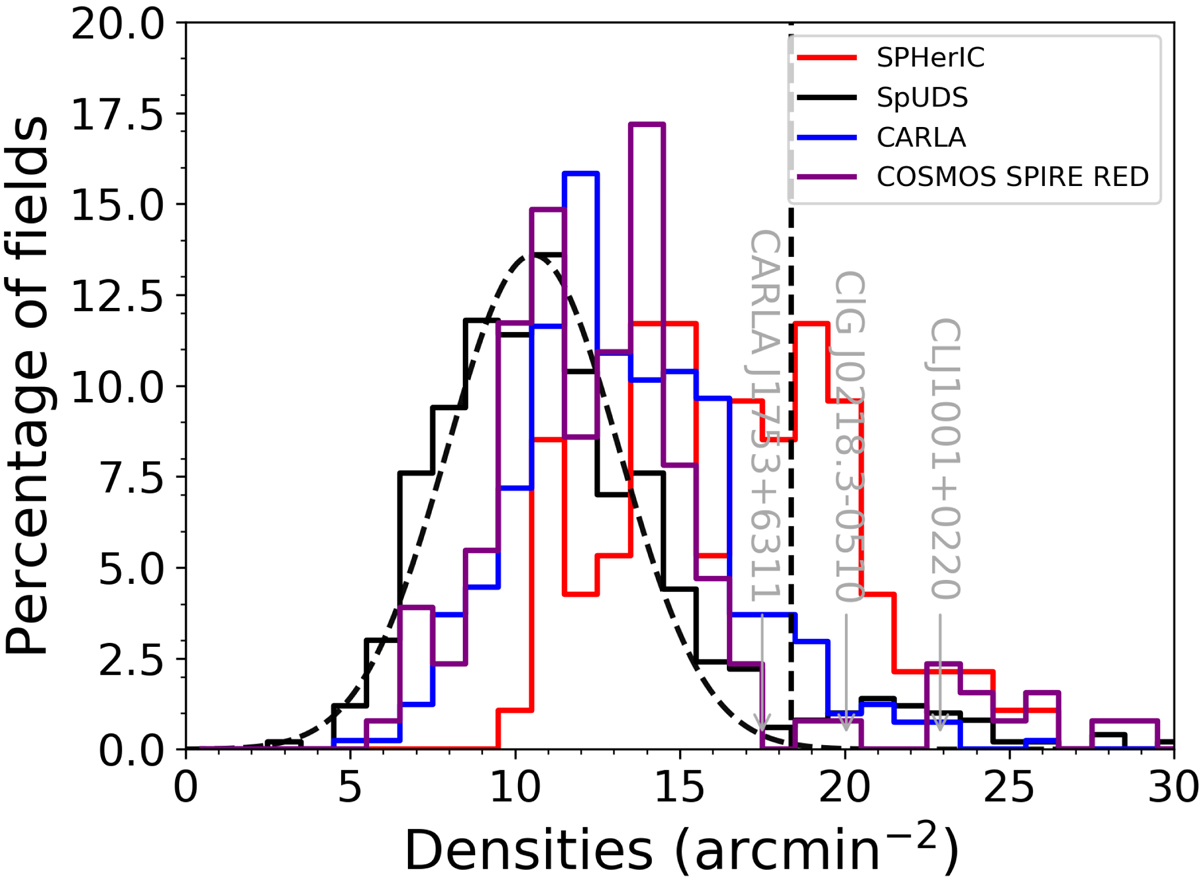
Distribution of surface densities of IRAC red sources in the SPHerIC sample (red histogram). These surface densities were estimated within a 1′ radius around each BRCG. For comparison, we show the surface density of random 1′ radius fields within the SpUDS images (black histogram). We fitted a Gaussian distribution to the lower half of the SpUDS distribution (black dashed curve). The blue histogram shows the distribution of surface densities from the CARLA cluster survey (Wylezalek et al. 2013). To compare our sample with random red SPIRE sources, selected in the same way as for the BRCGs in the SPHerIC sample, we estimated the surface density of red IRAC sources within 1′ radius of red SPIRE sources in the COSMOS field (purple histogram). The vertical black dashed line indicates the densities that are 3σ above the mean of the SPUDS control field, a reasonable line for demarcating overdense sources on scales of 1 arcmin. We note that 46% of the SPHerIC candidates are above this threshold compared to only 9% of the CARLA fields. As a reference, we also indicate in gray the surface densities of three other Spitzer selected spectroscopically confirmed clusters: CARLA J1753+6311, a cluster at z = 1.58 (Cooke et al. 2016; Rettura et al., in prep.) ClG J0218.3–0510, a protocluster at z = 1.62 (Papovich et al. 2010), and CL J1001+0220 at z = 2.506 (Wang et al. 2016).
Current usage metrics show cumulative count of Article Views (full-text article views including HTML views, PDF and ePub downloads, according to the available data) and Abstracts Views on Vision4Press platform.
Data correspond to usage on the plateform after 2015. The current usage metrics is available 48-96 hours after online publication and is updated daily on week days.
Initial download of the metrics may take a while.