Fig. 10.
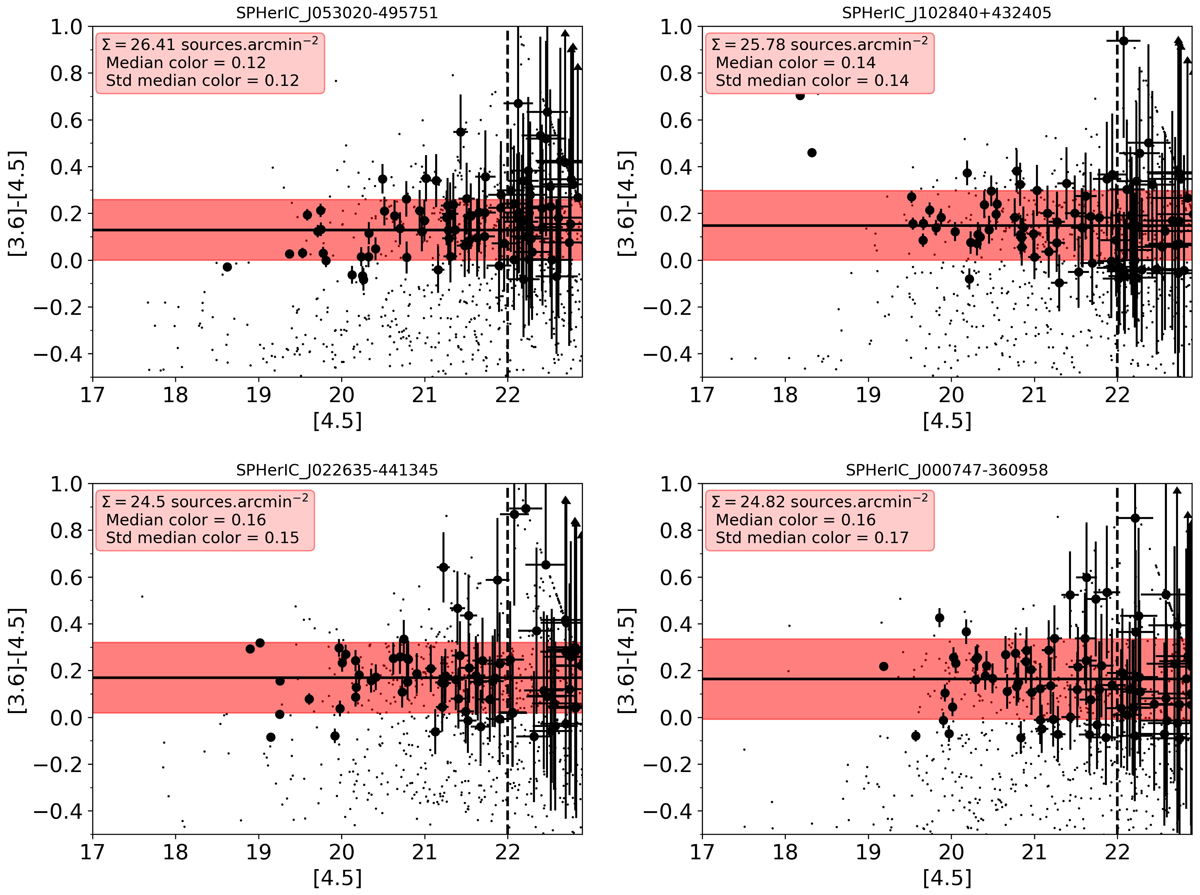
For four representative clusters in our sample, [3.6]−[4.5] color vs. [4.5] magnitude diagrams of red IRAC sources located within 1′ of the BRCG position are shown (large black circles). We represent all sources within the field for comparison (small black dots). Arrows indicate a non-detections at 3.6 μm. The median color for sources with [4.5] < 22 is indicated by the solid horizontal and vertical dashed black lines, respectively. The ± 1 σ range in the mean color is indicated by the red shaded area. The values of the average surface density (σ), mean color, and its standard deviation are given in each legend for each source.
Current usage metrics show cumulative count of Article Views (full-text article views including HTML views, PDF and ePub downloads, according to the available data) and Abstracts Views on Vision4Press platform.
Data correspond to usage on the plateform after 2015. The current usage metrics is available 48-96 hours after online publication and is updated daily on week days.
Initial download of the metrics may take a while.