Fig. 1.
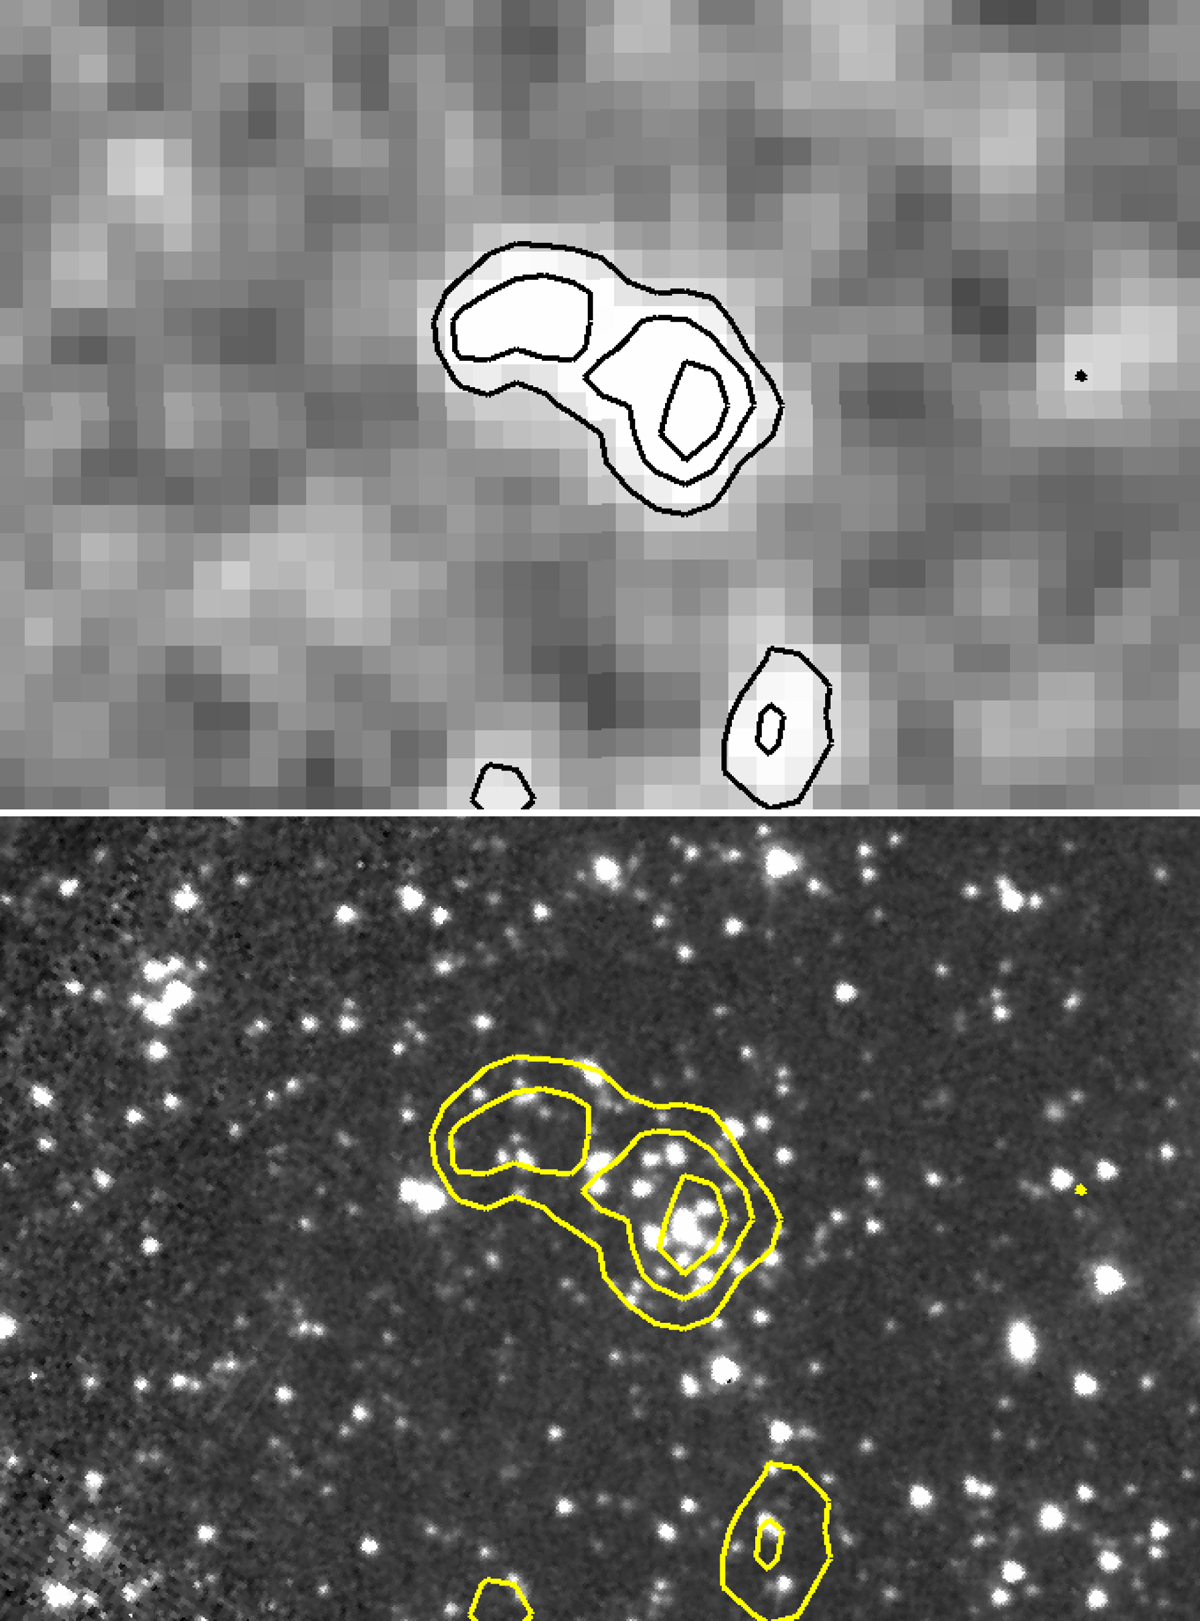
Top panel: 4.2′ × 3′ HerschelSPIRE 350 μm image of one SPHerIC survey field. Black contours indicate increasing emission levels at 3,4,5 σ about the RMS noise of the image. Bottom panel: Spitzer/IRAC 3.6 μm image of the same field. Yellow contours indicate the same SPIRE 350 μm emission levels as above. The gain in angular resolution in using IRAC at 3.6 μm is a factor ∼ 15 better than SPIRE at 350 μm. Thus, the IRAC imaging permits the identification of many individual galaxies within the SPIRE beam, as shown.
Current usage metrics show cumulative count of Article Views (full-text article views including HTML views, PDF and ePub downloads, according to the available data) and Abstracts Views on Vision4Press platform.
Data correspond to usage on the plateform after 2015. The current usage metrics is available 48-96 hours after online publication and is updated daily on week days.
Initial download of the metrics may take a while.