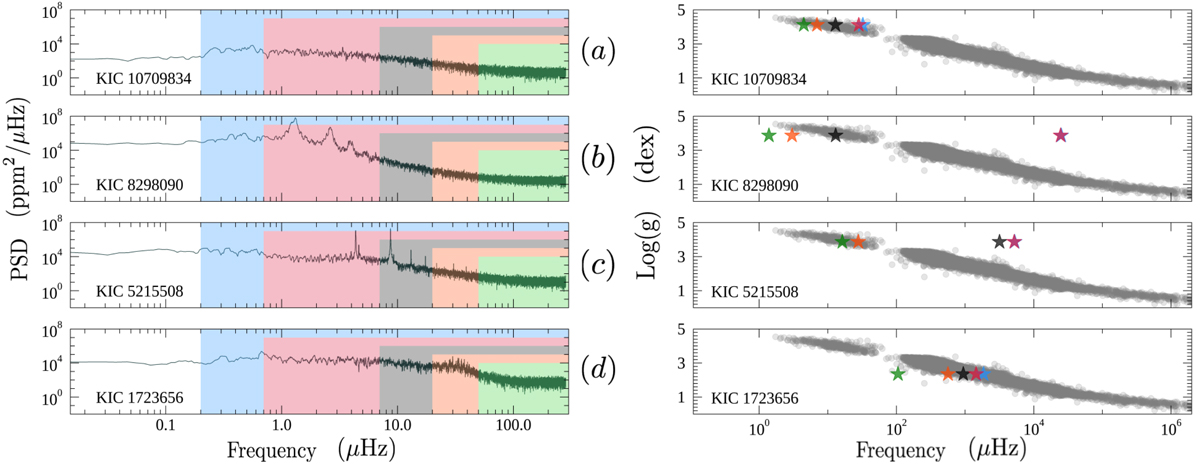
Fig. 2.

Impact of the lower frequency limit in the FliPer calculation on the estimation of surface gravity for different types of star. Left panels: power density spectra of four Kepler targets. Colored areas (blue, red, black, orange, and green) represent the different ranges of frequency used for FliPer calculation (respectively from 0.2, 0.7, 7, 20, and 50 μHz to the Nyquist frequency). The color scheme is the same in the captions. Right panels: all studied Kepler stars from Fig. 1 are represented in gray in the log g V.S FliPer diagram. Colored stars (blue, red, black, orange, and green) show the positions in the diagram of the four stars from the left panels with their color corresponding to the low-frequency boundaries used to compute the FliPer value. Panel a represents a MS star without any visible rotation component, panel b a MS star showing rotation, panel c a high-frequency rotating MS star, and panel d a RG star.
Current usage metrics show cumulative count of Article Views (full-text article views including HTML views, PDF and ePub downloads, according to the available data) and Abstracts Views on Vision4Press platform.
Data correspond to usage on the plateform after 2015. The current usage metrics is available 48-96 hours after online publication and is updated daily on week days.
Initial download of the metrics may take a while.


