Fig. 2.
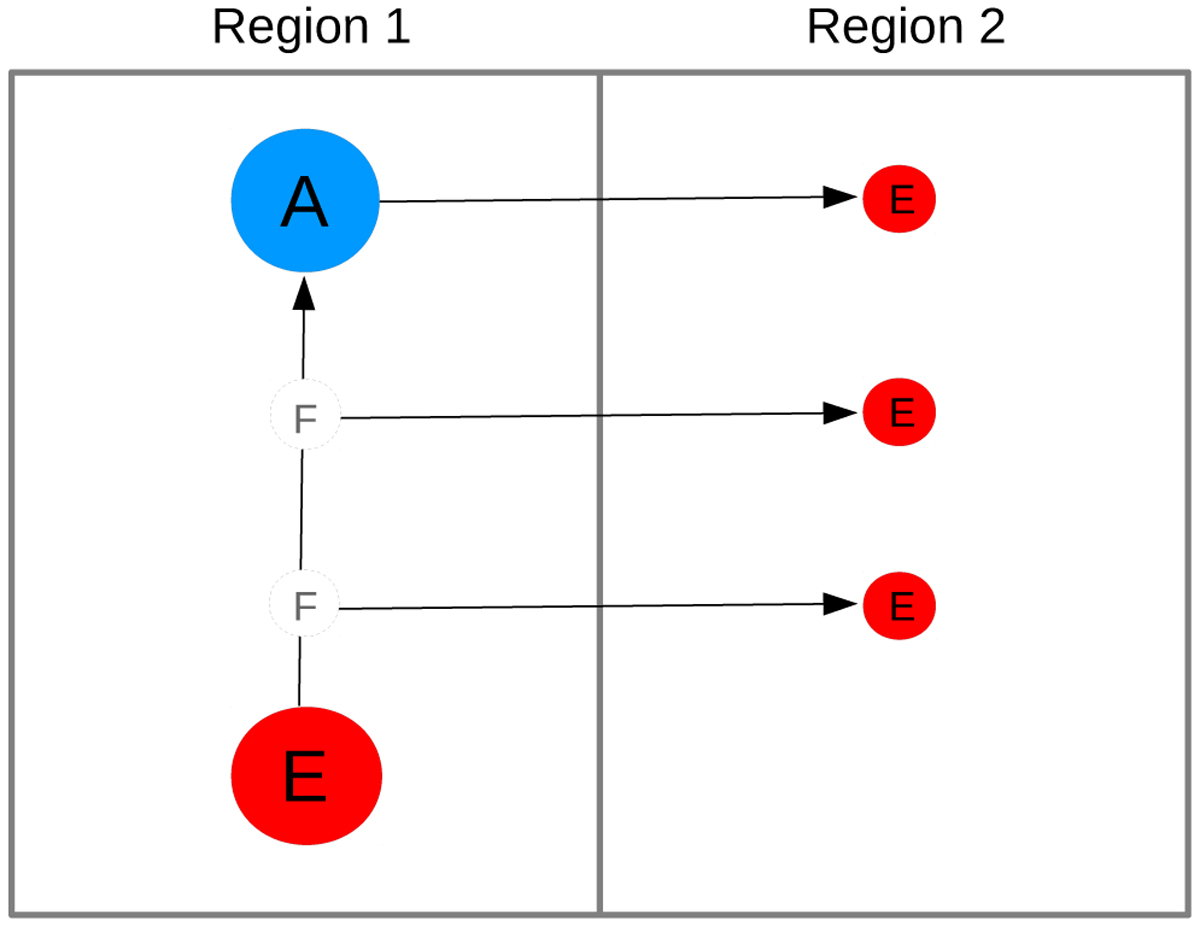
Schematic figure of the re-sampling procedure for physical events. A packet emitted in region 1 with a large packet size (left), give rise to emission in region 2 with a small packet size (right) through fictitious absorption, and is eventually physically absorbed. Regions 1 and 2 are assumed to be spatially coincident but separated in frequency. The circles indicates the size of the packets, emission is labelled with an E, and physical and fictitious absorption is labelled with an A and an F, respectively.
Current usage metrics show cumulative count of Article Views (full-text article views including HTML views, PDF and ePub downloads, according to the available data) and Abstracts Views on Vision4Press platform.
Data correspond to usage on the plateform after 2015. The current usage metrics is available 48-96 hours after online publication and is updated daily on week days.
Initial download of the metrics may take a while.