Fig. 19.
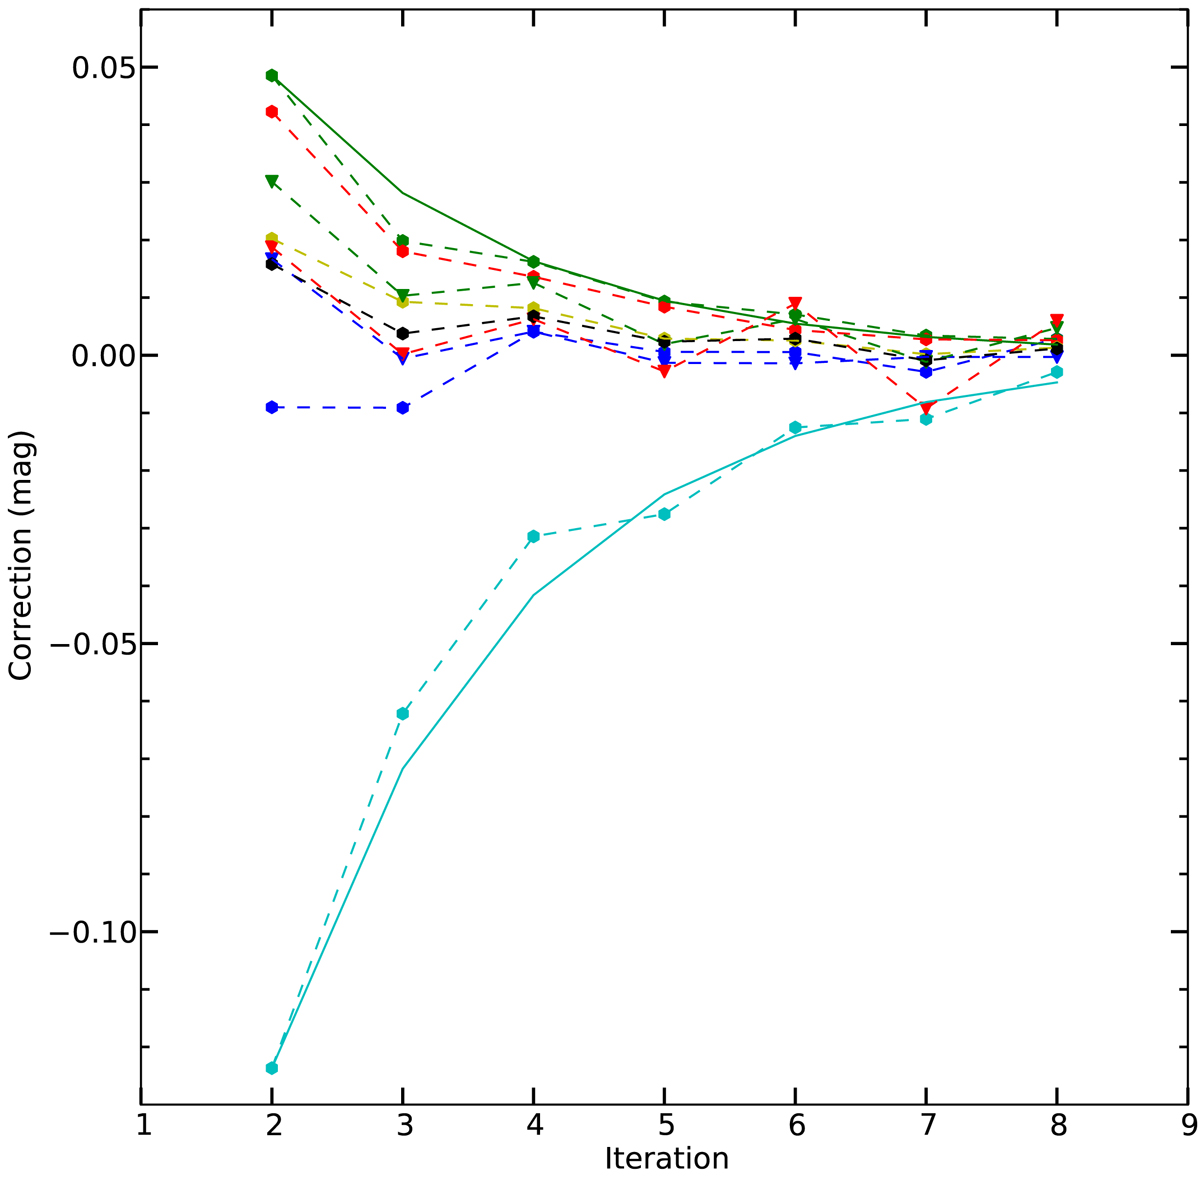
Correction per Λ-iteration averaged between 15 and 40 days for the broad-band and bolometric lightcurves of model 12C. The colours used for the bands are the same as in Fig. 12, and the optical and NIR bands have been marked with circles and triangles, respectively. For the U- and V-bands we also show the curves of geometric convergence for a ratio of successive corrections of 0.58.
Current usage metrics show cumulative count of Article Views (full-text article views including HTML views, PDF and ePub downloads, according to the available data) and Abstracts Views on Vision4Press platform.
Data correspond to usage on the plateform after 2015. The current usage metrics is available 48-96 hours after online publication and is updated daily on week days.
Initial download of the metrics may take a while.