Free Access
Fig. 6.
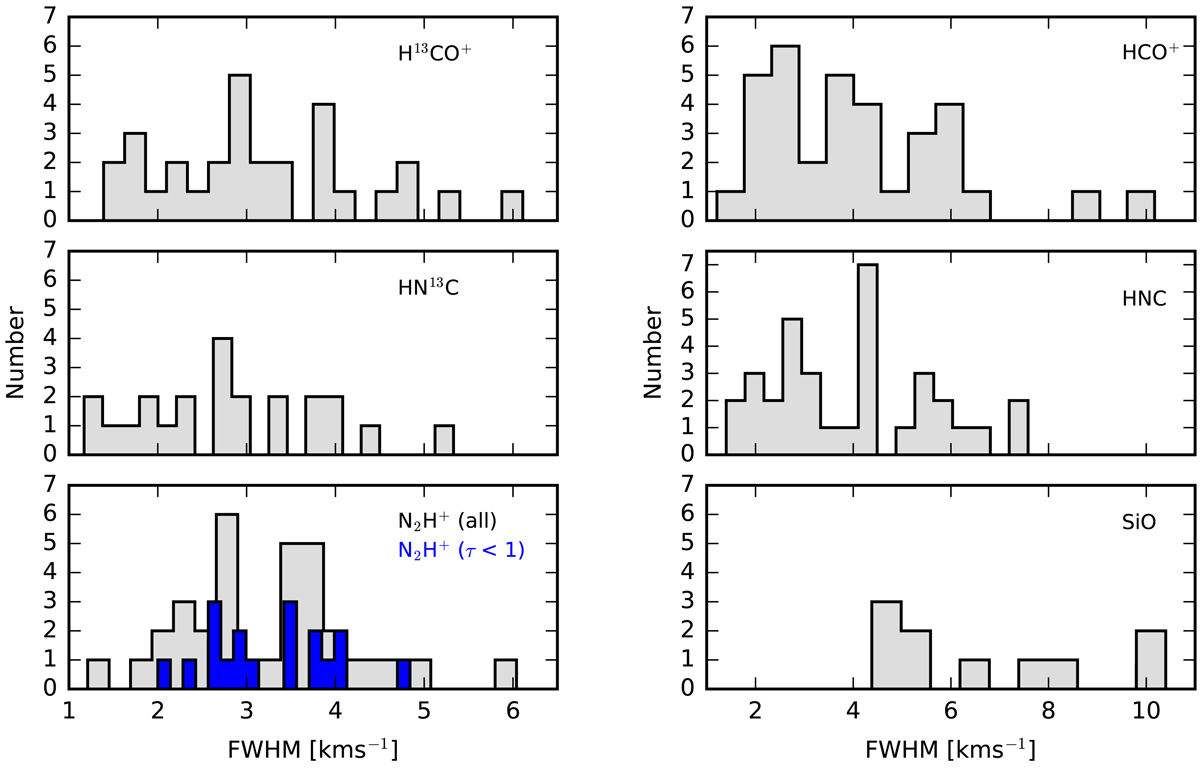
Histograms of the number distributions of line widths. Left column: for the H13CO+, HN13C, and N2H+ lines. Optically thin N2H+ lines are plotted in blue. Right column: for the HCO+, HNC, and SiO lines.
Current usage metrics show cumulative count of Article Views (full-text article views including HTML views, PDF and ePub downloads, according to the available data) and Abstracts Views on Vision4Press platform.
Data correspond to usage on the plateform after 2015. The current usage metrics is available 48-96 hours after online publication and is updated daily on week days.
Initial download of the metrics may take a while.