Fig. A.1.
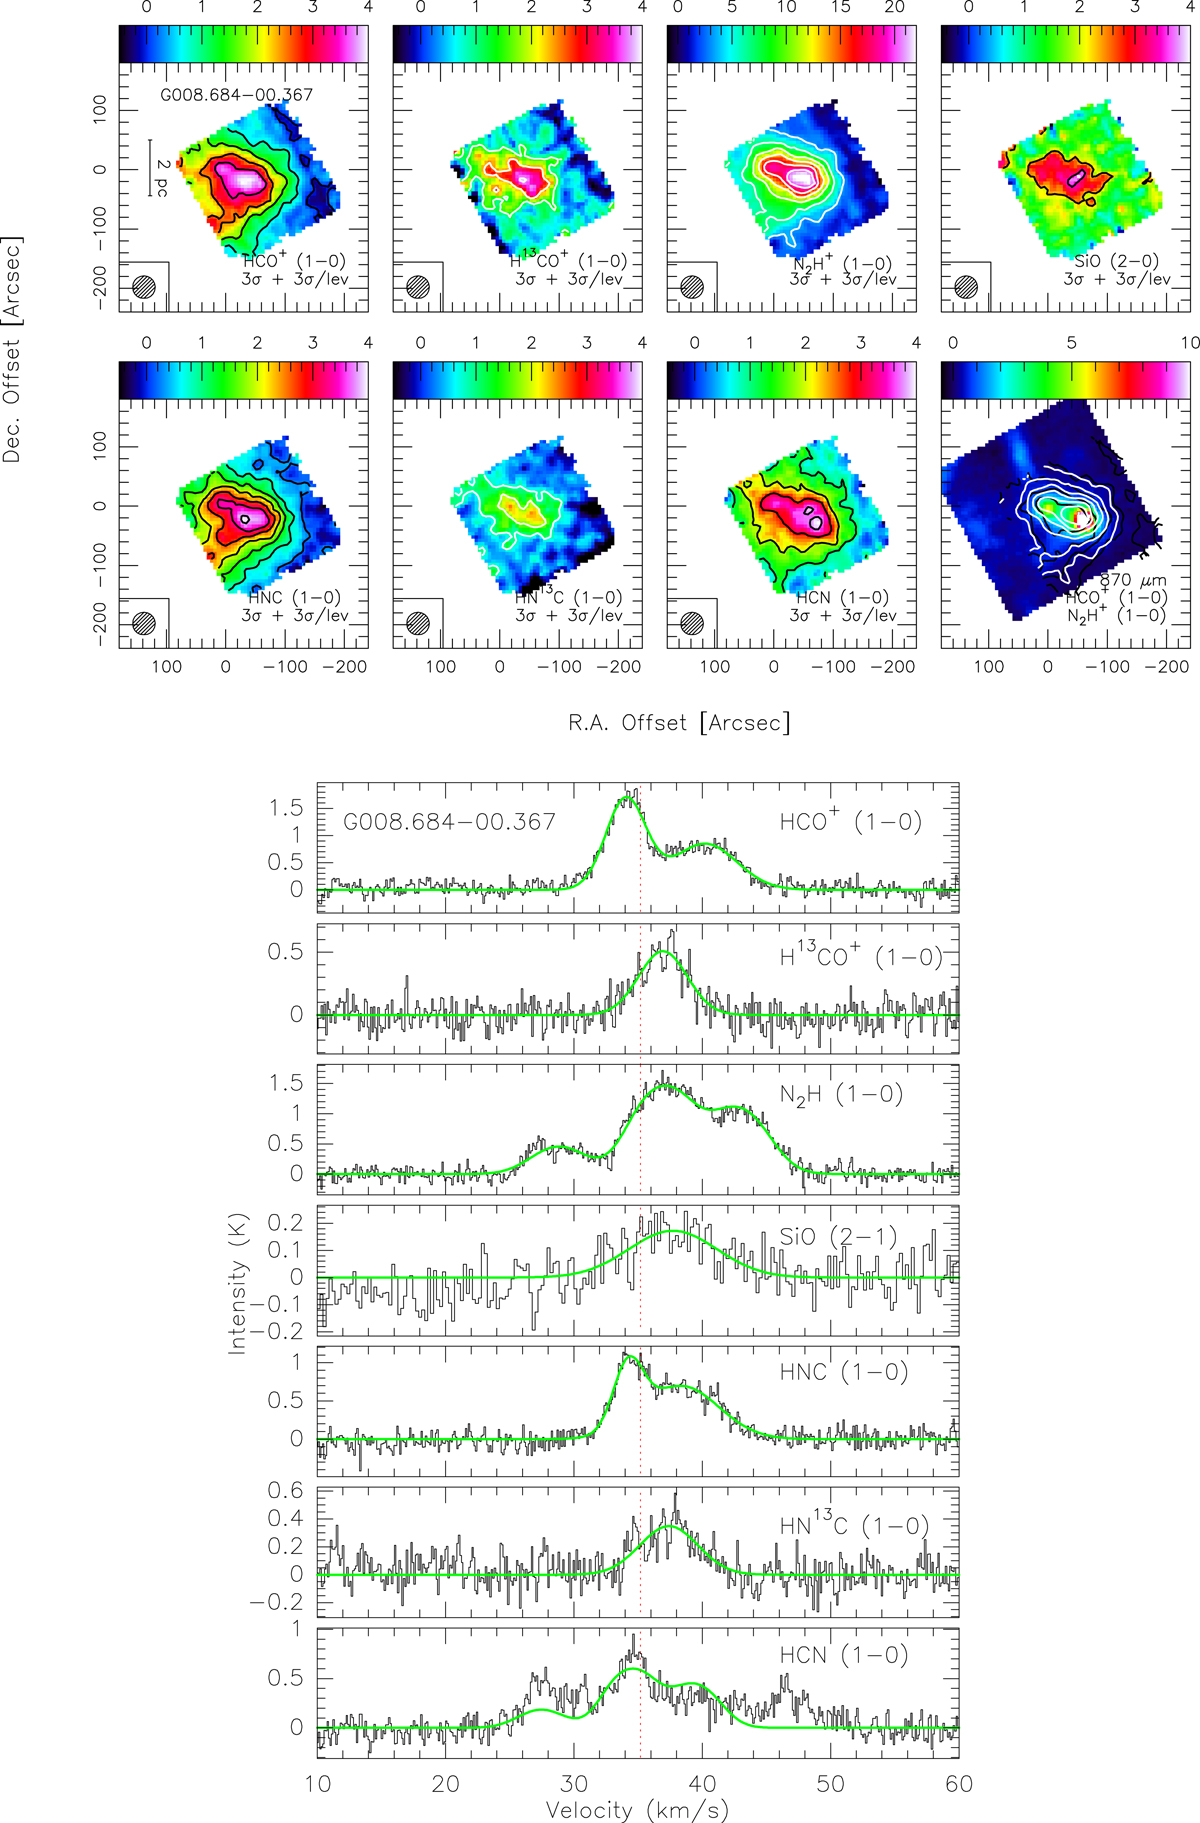
Top panels: integrated intensity maps of the HCO+(1−0), H13CO+(1−0), SiO, N2H+(1−0), HNC(1−0), HN13C(1−0) and HCN(1−0) emission for the high-mass ATLASGAL clumps. The last panel shows the zero moment map contours of the HCO+ (black) and N2H+ (white) line emissions overlaid on the ATLASGAL submm continuum emission at 870 μm. Contour levels are shown on each image. The Mopra telescope beam size is shown on the left corner of the maps. Bottom panels: HCO+,H13CO+,N2H+,SiO,HNC,HN13C,HCN spectra for all sources. Velocity range is 50 km s−1. The spectra is created by averaging the spectra in 38″ × 38″ box (MOPRA beam size) around the clump’s N2H+ peak emission. The vertical red dotted line indicates the radial velocity of the ammonia line for the clumps given in Wienen et al. (2015). The single and double Gaussian or hyperfine line fits are shown with green lines.
Current usage metrics show cumulative count of Article Views (full-text article views including HTML views, PDF and ePub downloads, according to the available data) and Abstracts Views on Vision4Press platform.
Data correspond to usage on the plateform after 2015. The current usage metrics is available 48-96 hours after online publication and is updated daily on week days.
Initial download of the metrics may take a while.