Fig. 9.
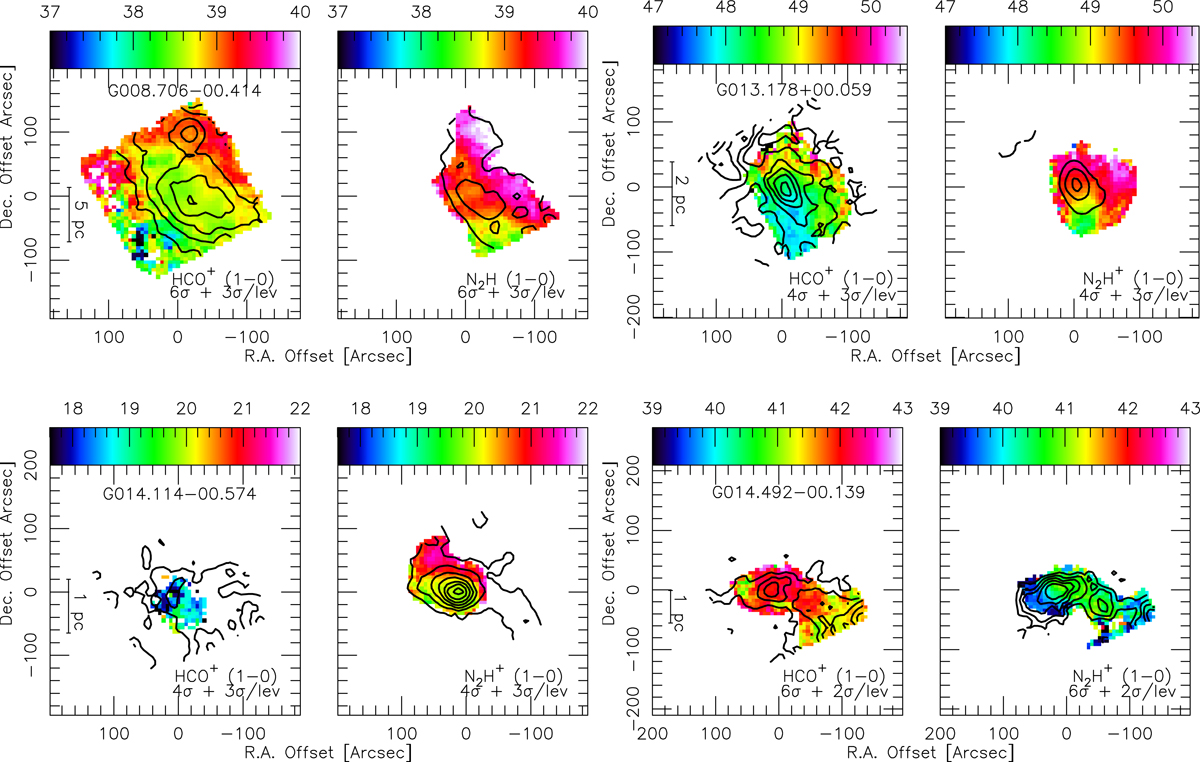
Velocity (moment 1) maps overlaid with the intensity contours of the same line showing the velocity gradients in each clump. The top color bar is in units of km s−1. Contour levels are shown on each image. All the velocity maps are generated with 3σ level of the average rms of HCO+ and N2H+ channel maps. We show only a few examples here; maps for all the sources can be found in Fig. A.1.
Current usage metrics show cumulative count of Article Views (full-text article views including HTML views, PDF and ePub downloads, according to the available data) and Abstracts Views on Vision4Press platform.
Data correspond to usage on the plateform after 2015. The current usage metrics is available 48-96 hours after online publication and is updated daily on week days.
Initial download of the metrics may take a while.