Fig. 6.
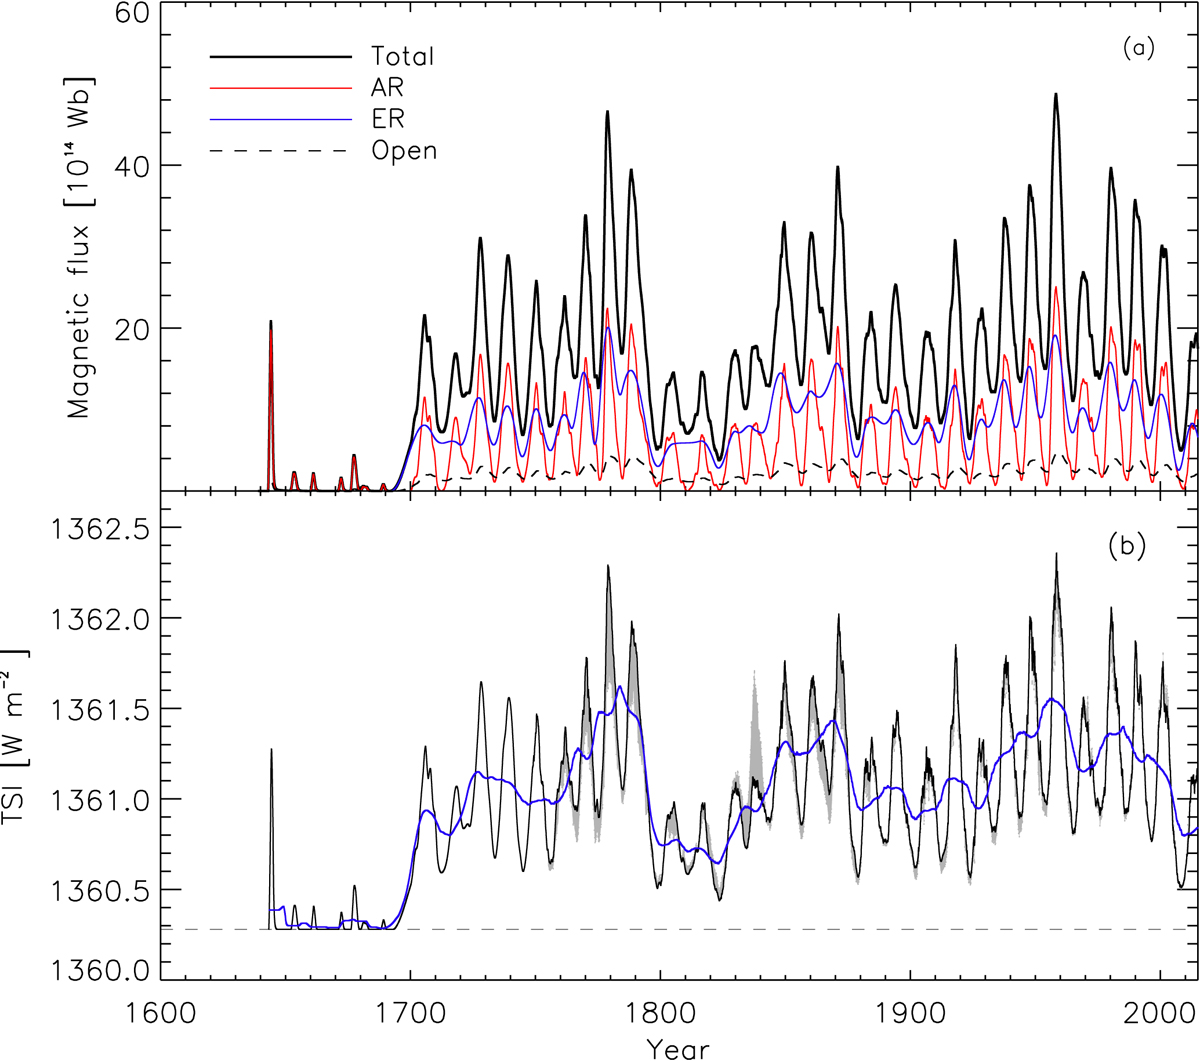
Panel a: reconstructed magnetic flux (361-day moving averages) at the solar surface since 1639: total magnetic flux (thick black), AR flux (red), ER flux (blue) and open flux (dashed). Panel b: reconstructed TSI back to 1639 (361-day moving averages in black and 11-year smooth in blue). The horizontal dashed line shows the Maunder minimum level. The gray shaded area represents the uncertainty range due to the choice of the sunspot record (see main text for details).
Current usage metrics show cumulative count of Article Views (full-text article views including HTML views, PDF and ePub downloads, according to the available data) and Abstracts Views on Vision4Press platform.
Data correspond to usage on the plateform after 2015. The current usage metrics is available 48-96 hours after online publication and is updated daily on week days.
Initial download of the metrics may take a while.