Fig. 4.
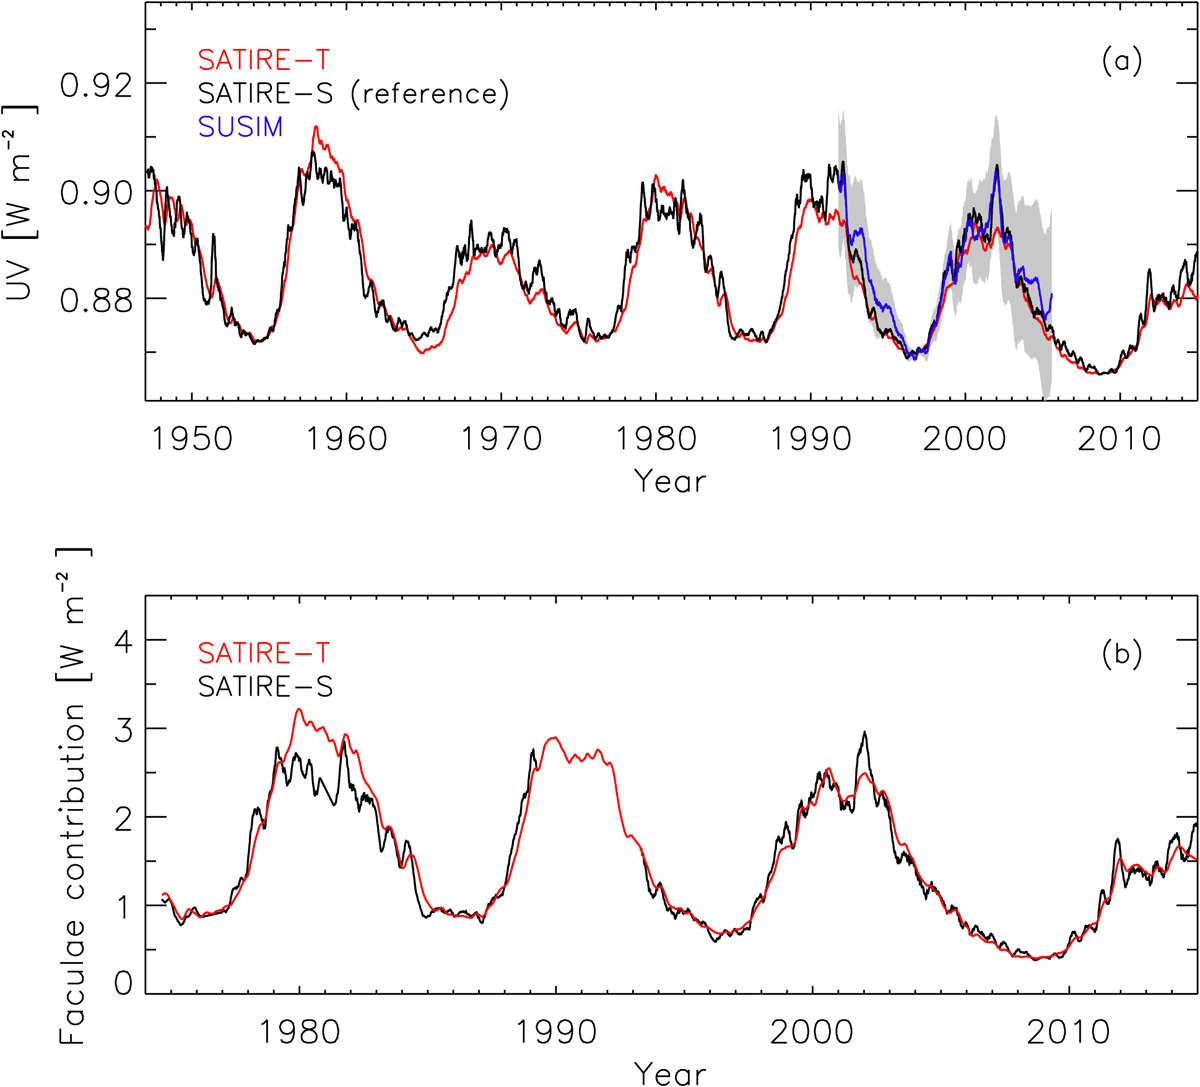
Panel a: UV irradiance integrated over the range 220–240 nm as reconstructed here (red), modelled with SATIRE-S (black; reference data set from Yeo et al. 2014) and measured by UARS/SUSIM (blue, Floyd et al. 2003). The long-term uncertainty of the UARS/SUSIM measurements (taking the 1996 minimum as a reference) is shown by the shaded area. Panel b: facular contribution to the TSI changes modelled with SATIRE-T (red) and obtained from full-disc solar magnetograms (SATIRE-S; black). In the SATIRE-S model the period between 1990 and 1993 is not shown due to gaps in the input data (Yeo et al. 2014). All curves are in 81-day moving averages.
Current usage metrics show cumulative count of Article Views (full-text article views including HTML views, PDF and ePub downloads, according to the available data) and Abstracts Views on Vision4Press platform.
Data correspond to usage on the plateform after 2015. The current usage metrics is available 48-96 hours after online publication and is updated daily on week days.
Initial download of the metrics may take a while.