Fig. 2.
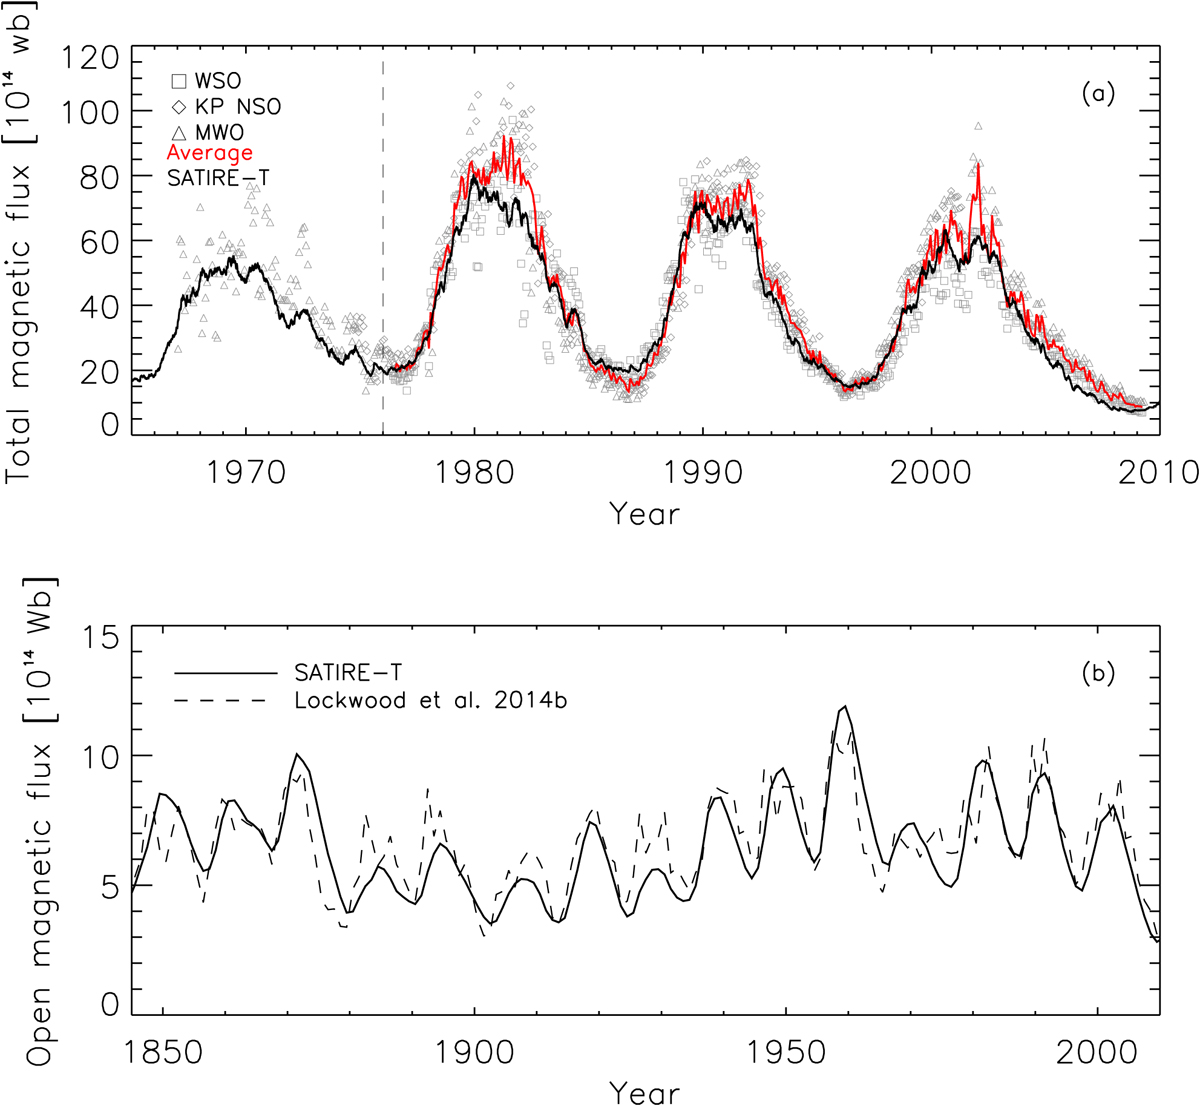
Panel a: three-month moving averaged reconstructed total magnetic flux (thick black line) compared to the averages of the three observational data sets (thick red line). The three individual observational data sets are WSO (squares), KP NSO (diamonds), and MWO (triangles). The reconstructed total magnetic flux shown is ϕtot = ϕact + 0.4ϕeph + ϕopen, to take the unresolved magnetic flux in small ephemeral regions into account (see Sect. 2.2.3). Panel b: yearly averaged reconstructed OMF (solid line) since 1845 and the reconstruction from the aa-index by Lockwood et al. (2014a, dashed line).
Current usage metrics show cumulative count of Article Views (full-text article views including HTML views, PDF and ePub downloads, according to the available data) and Abstracts Views on Vision4Press platform.
Data correspond to usage on the plateform after 2015. The current usage metrics is available 48-96 hours after online publication and is updated daily on week days.
Initial download of the metrics may take a while.