Fig. 8.
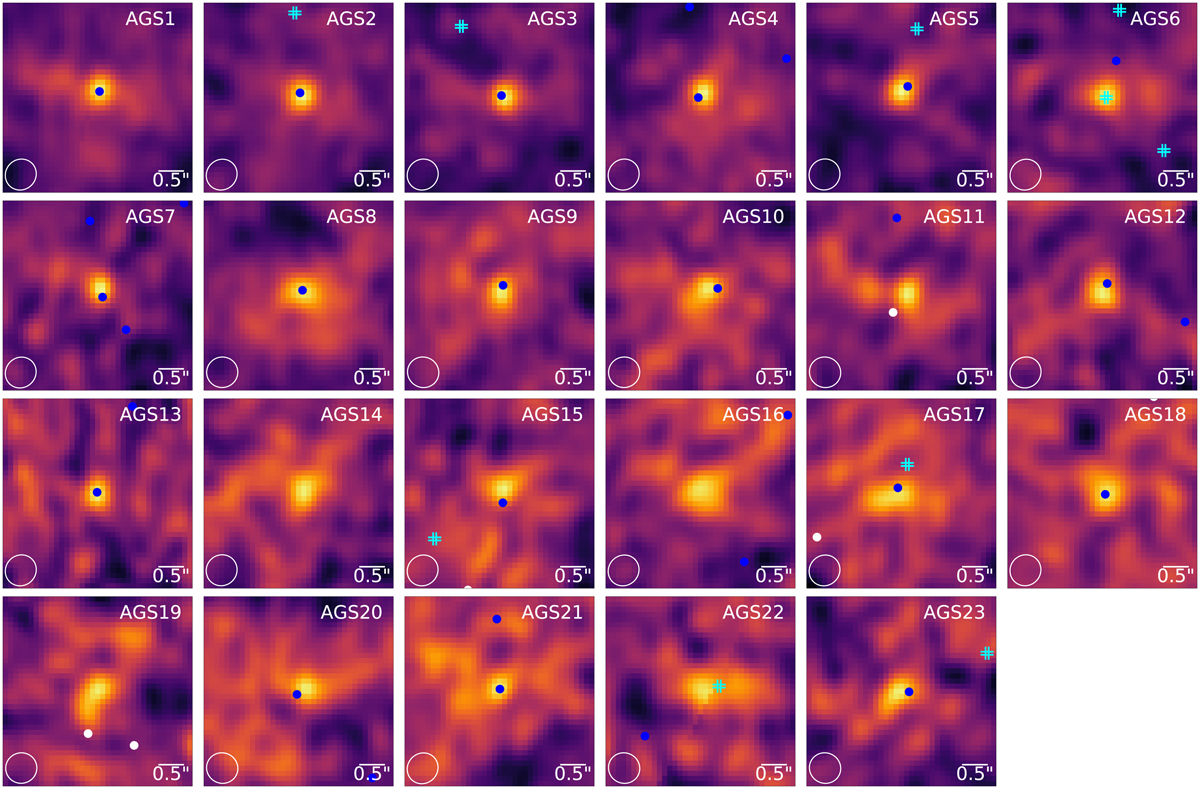
ALMA 1.1 mm continuum maps for the 23 detections tapered at 0.60 arcsec. Each 3″5 × 3″5 image is centered on the position of the ALMA detection. Cyan double crosses show sources from the GOODS-S CANDELS catalog. White circles show sources from the ZFOURGE catalog. Blue circles show common sources from both optical catalogs (sources with an angular separation lower than 0″4). The shape of the synthesized beam is given in the bottom left corner.
Current usage metrics show cumulative count of Article Views (full-text article views including HTML views, PDF and ePub downloads, according to the available data) and Abstracts Views on Vision4Press platform.
Data correspond to usage on the plateform after 2015. The current usage metrics is available 48-96 hours after online publication and is updated daily on week days.
Initial download of the metrics may take a while.