Fig. 5.
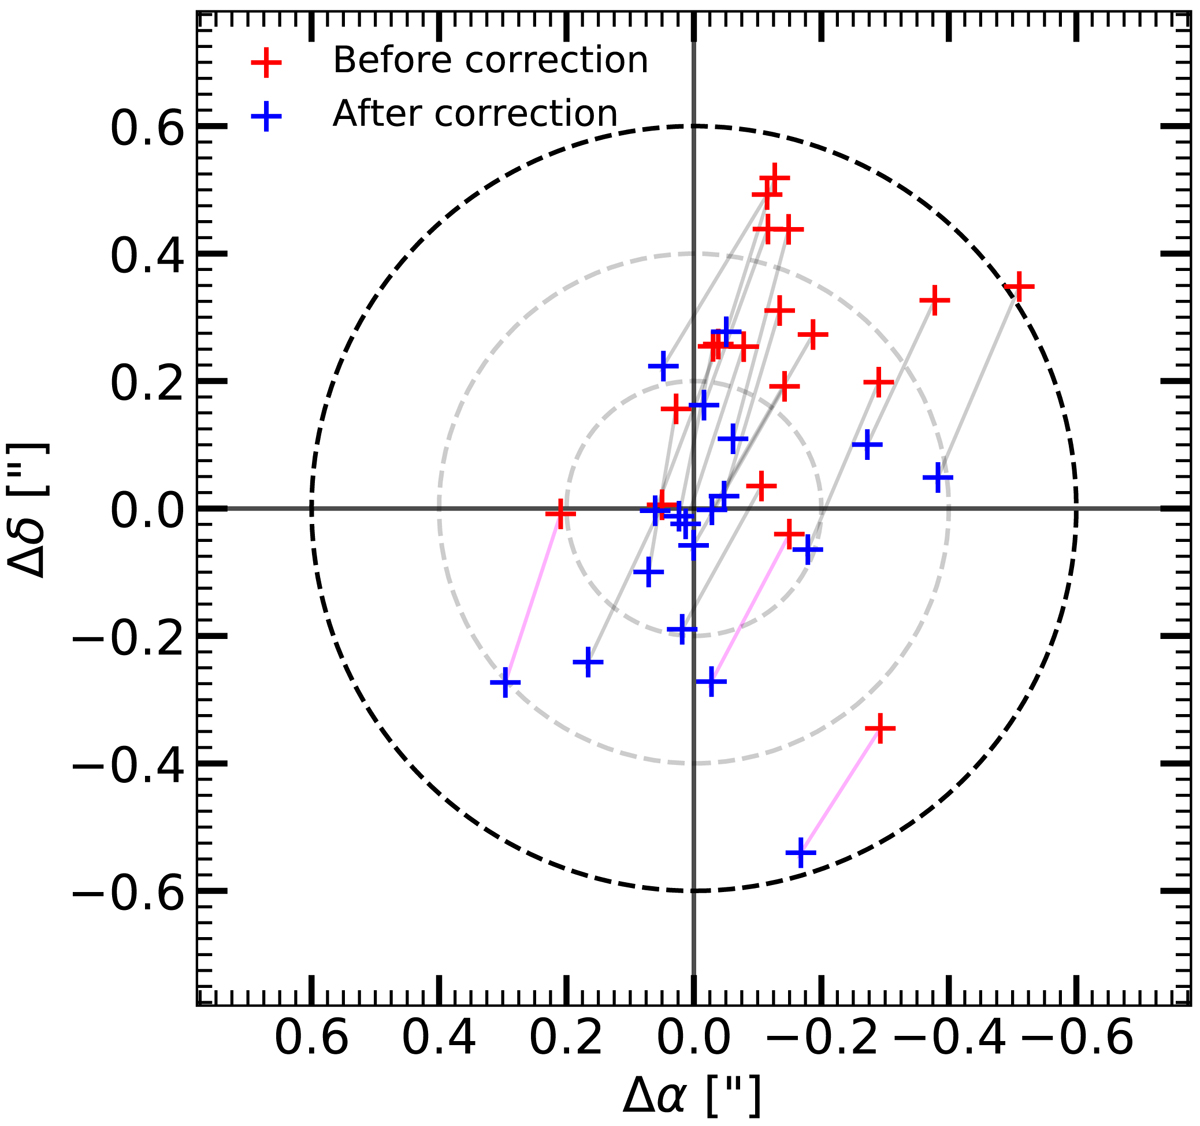
Positional offset (RAHST–RAALMA, DecHST–DecALMA) between HST and ALMA before (red crosses) and after (blue crosses) the correction of both a global systematic offset and a local offset. The black dashed circle corresponds to the cross-matching limit radius of 0″6. The gray dashed circles show a positional offset of 0″2 and 0″4 respectively. The magenta lines indicate the HST galaxies previously falsely associated with ALMA detections.
Current usage metrics show cumulative count of Article Views (full-text article views including HTML views, PDF and ePub downloads, according to the available data) and Abstracts Views on Vision4Press platform.
Data correspond to usage on the plateform after 2015. The current usage metrics is available 48-96 hours after online publication and is updated daily on week days.
Initial download of the metrics may take a while.