Fig. 4.
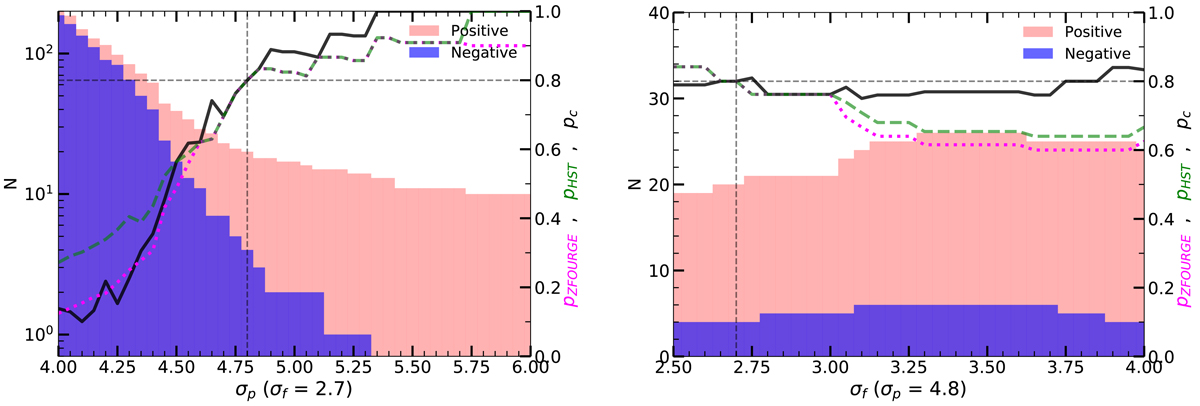
Cumulative number of positive (red histogram) and negative (blue histogram) detections as a function of the σp (at a fixed σf, left panel) and σf (at a fixed σp, right panel) in units of σ. Solid black line represents the purity criterion pc define by Eq. (1), green dashed-line represents the percentage of positive detection with HST-WFC3 counterpart pHST and magenta dashed-line represents the percentage of positive detection with ZFOURGE counterpart pZFOURGE. Gray dashed-lines show the thresholds σp = 4.8σ and σf = 2.7σ and the 80% purity limit.
Current usage metrics show cumulative count of Article Views (full-text article views including HTML views, PDF and ePub downloads, according to the available data) and Abstracts Views on Vision4Press platform.
Data correspond to usage on the plateform after 2015. The current usage metrics is available 48-96 hours after online publication and is updated daily on week days.
Initial download of the metrics may take a while.