Fig. 3.
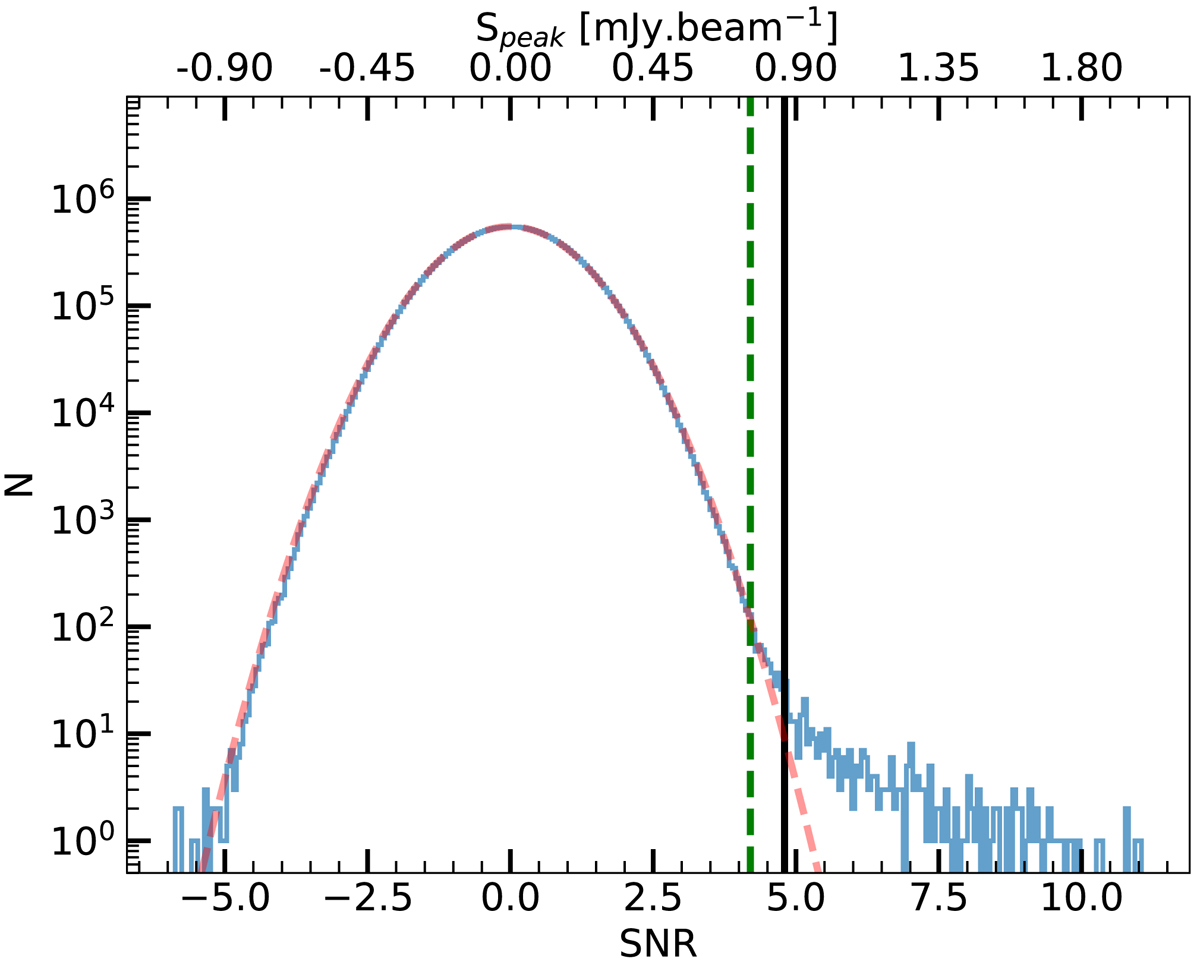
Histogram of pixels of the S/N map, where pixels with noise >0.3 mJy beam−1 have been removed. The red dashed line is the best Gaussian fit. The green dashed line is indicative and shows where the pixel brightness distribution moves away from the Gaussian fit. This is also the 4.2σ level corresponding to a peak flux of 0.76 mJy for a typical noise per beam of 0.18 mJy. The solid black line corresponds to our peak threshold of 4.8σ (0.86 mJy).
Current usage metrics show cumulative count of Article Views (full-text article views including HTML views, PDF and ePub downloads, according to the available data) and Abstracts Views on Vision4Press platform.
Data correspond to usage on the plateform after 2015. The current usage metrics is available 48-96 hours after online publication and is updated daily on week days.
Initial download of the metrics may take a while.