Fig. 19.
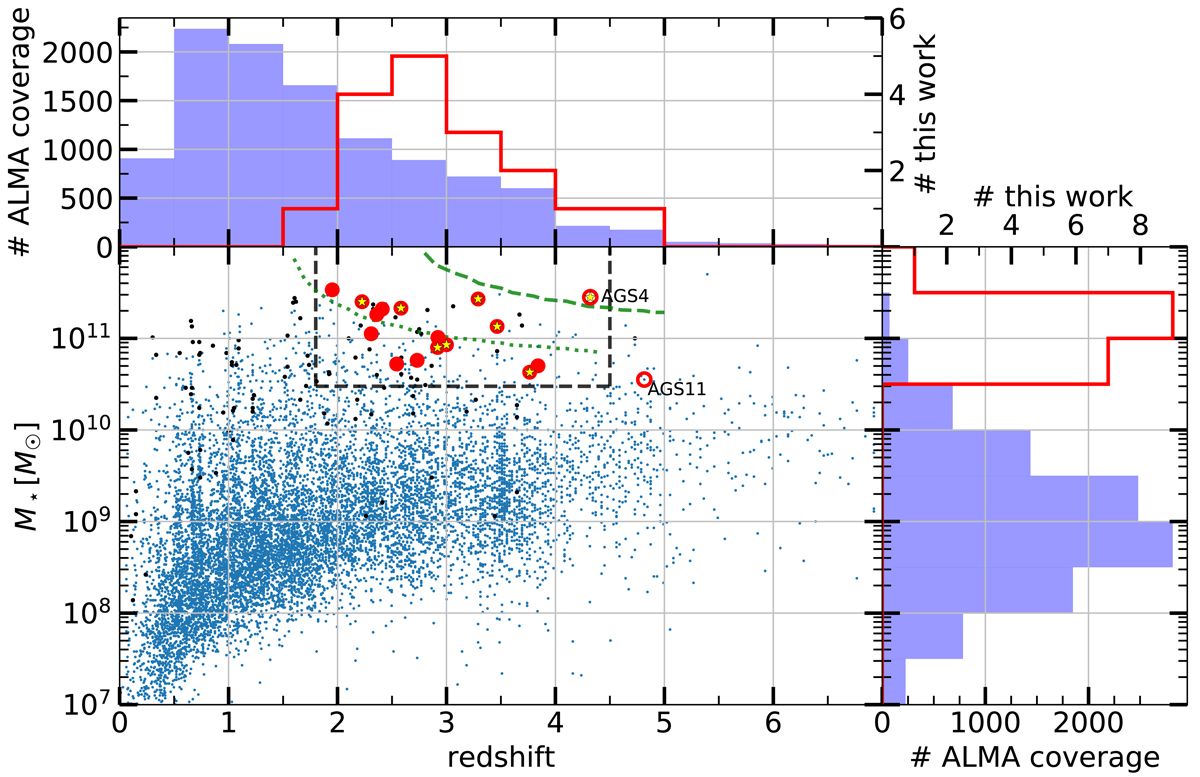
Stellar mass versus redshift for the galaxies detected in our ALMA GOODS-South blind survey (red points). For comparison, the distribution of all of the galaxies, listed in the ZFOURGE catalog, in the same field of view is given in blue. Only UVJ active galaxies are shown. The two HST-dark galaxies for which we have redshifts (AGS4 and AGS11) are represented by open circles. The redshift of AGS11 is however uncertain. The green dashed line shows the position that would be occupied by a typical star-forming galaxy – lying on the median of the SFR–M⋆ star-formation main sequence (MS) – that would produce a 1.1 mm flux density equal to our average detection limit of 0.88 mJy (4.8-σ) using the spectral energy distribution (SED) library of Schreiber et al. (2018). The dotted line illustrates the position of galaxies 3 times above the MS using the appropriate SEDs from the same library. Galaxies hosting an AGN that are undetected or detected by ALMA are identified with black dots and yellow stars respectively. Inside the black dashed rectangle, 50% of the galaxies detected by ALMA host an AGN, while only 14% of the UVJ active galaxies undetected by ALMA host an AGN.
Current usage metrics show cumulative count of Article Views (full-text article views including HTML views, PDF and ePub downloads, according to the available data) and Abstracts Views on Vision4Press platform.
Data correspond to usage on the plateform after 2015. The current usage metrics is available 48-96 hours after online publication and is updated daily on week days.
Initial download of the metrics may take a while.