Fig. 18.
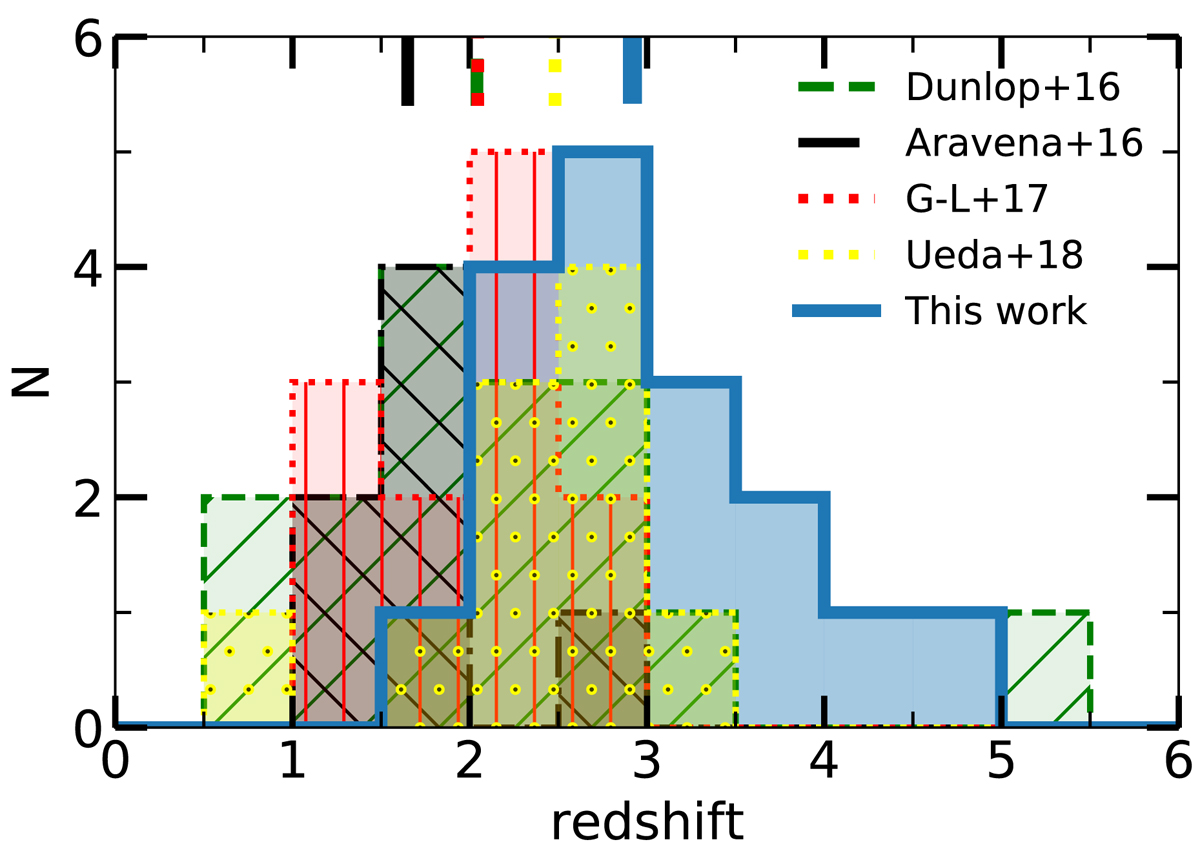
Redshift distributions (photometric or spectroscopic) for millimeter-selected galaxies. The blue solid line shows the redshift distribution of our ALMA GOODS-South blind survey. The green dashed line shows the Hubble Ultra Deep Field Survey redshift distribution (Dunlop et al. 2017), the black dash-dotted line shows the ASPECS sample (Aravena et al. 2016), the red dotted line shows the ALMA Frontier Fields survey (González-López et al. 2017) and the yellow dotted line shows the ASAGAO survey (Ueda et al. 2018). Short colored lines at the top of the figure indicate the median redshifts for these four studies.
Current usage metrics show cumulative count of Article Views (full-text article views including HTML views, PDF and ePub downloads, according to the available data) and Abstracts Views on Vision4Press platform.
Data correspond to usage on the plateform after 2015. The current usage metrics is available 48-96 hours after online publication and is updated daily on week days.
Initial download of the metrics may take a while.