Fig. 16.
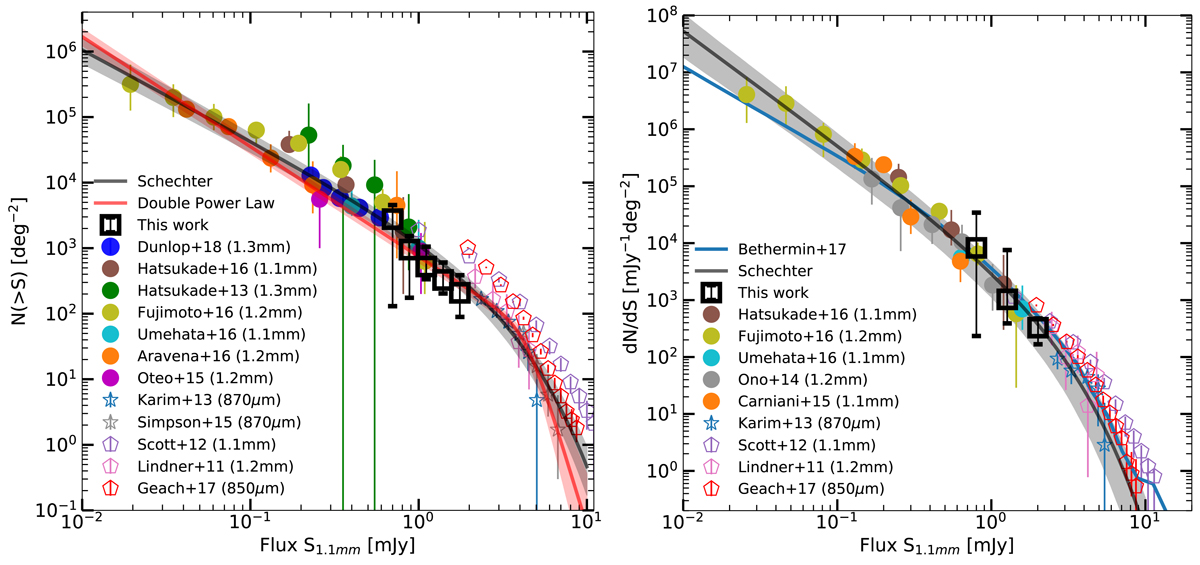
1.1-mm cumulative (left panel) and differential (right panel) number counts derived using the corrections described in Sect. 5.4, for the sources detected at > 4.8σ in the main catalog. AGS19 is located at a position where the noise is artificially low, and has therefore not been taken into account. Previous (sub)millimeter cumulative number counts are also shown (Lindner et al. 2011; Scott et al. 2012; Karim et al. 2013; Hatsukade et al. 2013, 2016; Ono et al. 2014; Simpson et al. 2015b; Oteo et al. 2016; Carniani et al. 2015; Aravena et al. 2016; Fujimoto et al. 2016; Umehata et al. 2017; Geach et al. 2017; Dunlop et al. 2017). The different fluxes are scaled to 1.1 mm flux densities using S1.1 mm/S1.2 mm = 1.29, S1.1 mm/S1.3 mm = 1.48, S1.1 mm/S870 μm = 0.56. From the Umehata et al. (2017) study, we used only sources which do not have z = 3.09, (which means we are excluding the protocluster members). Results from single-dish surveys are shown with unfilled pentagon markers and are only indicative, they are not considered for model fitting. The gray curve shows the best-fit Schechter function (with 1-σ) uncertainties, the red curve shows the best-fit DPL function (with 1-σ).
Current usage metrics show cumulative count of Article Views (full-text article views including HTML views, PDF and ePub downloads, according to the available data) and Abstracts Views on Vision4Press platform.
Data correspond to usage on the plateform after 2015. The current usage metrics is available 48-96 hours after online publication and is updated daily on week days.
Initial download of the metrics may take a while.