Fig. 15.
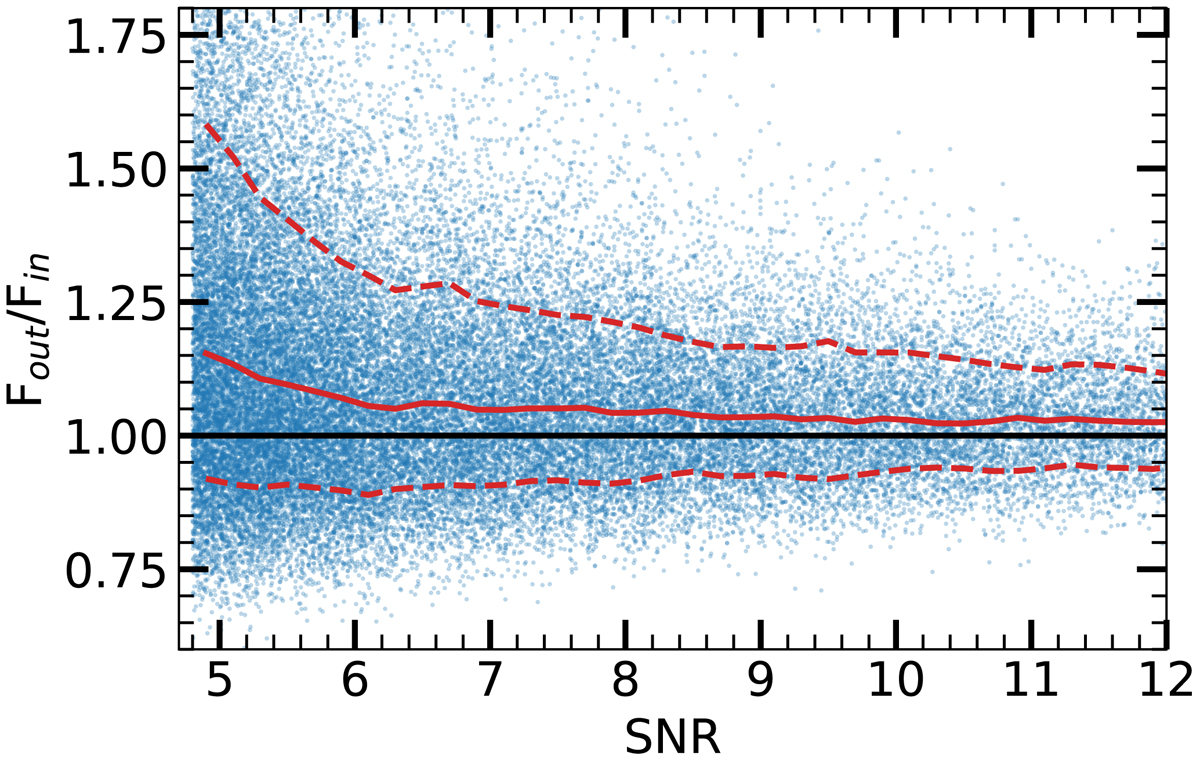
Flux boosting as a function of measured S/N estimated from simulations. The median of the boosting is shown by a solid red line. The 1σ confidence intervals (dashed red lines) are overplotted. The solid black horizontal line corresponds to Fout = Fin (see text for details). We used the same set of simulations that we used for the completeness analysis.
Current usage metrics show cumulative count of Article Views (full-text article views including HTML views, PDF and ePub downloads, according to the available data) and Abstracts Views on Vision4Press platform.
Data correspond to usage on the plateform after 2015. The current usage metrics is available 48-96 hours after online publication and is updated daily on week days.
Initial download of the metrics may take a while.