Free Access
Fig. 13.
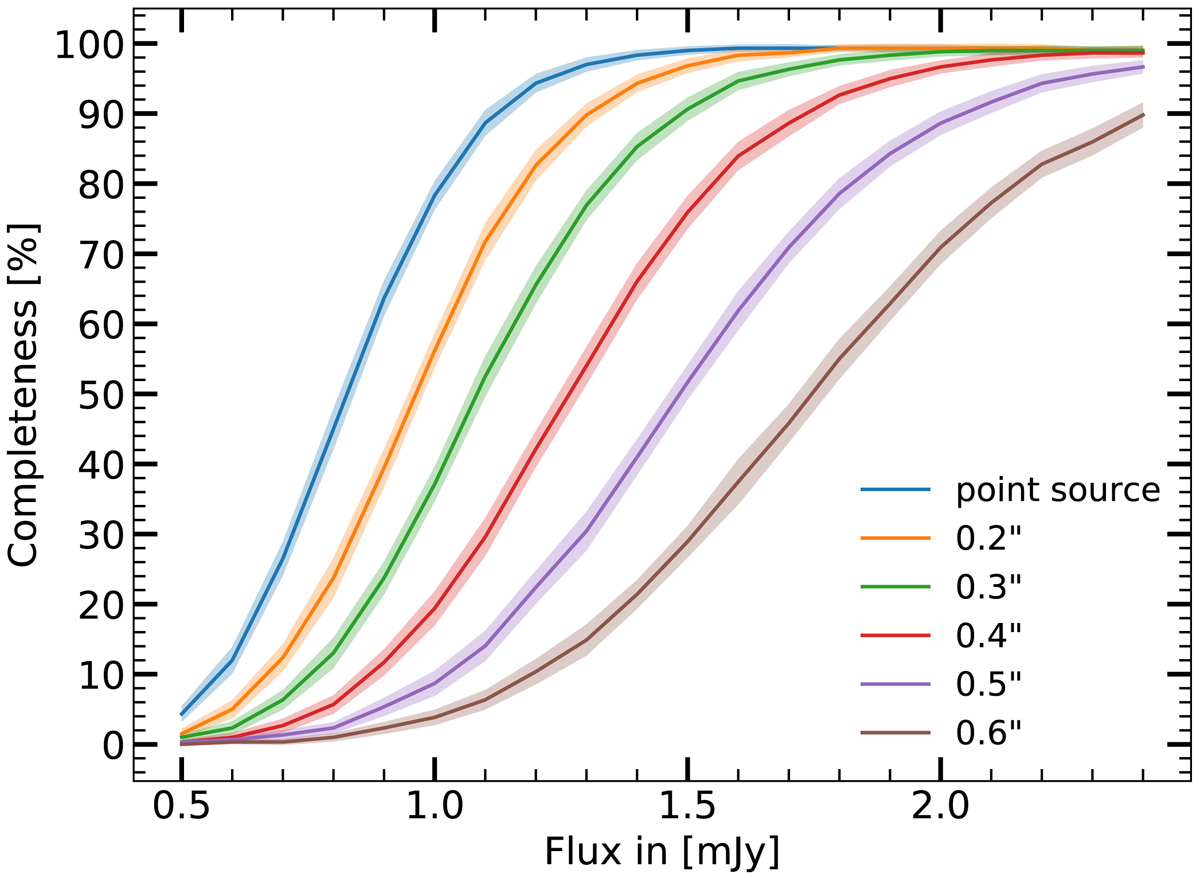
Median source detection completeness for simulated point-like and Gaussian galaxies as a function of integrated flux, for different FWHMs (see figure’s legend). The shaded regions correspond to the standard deviation of 100 runs, each containing 300 simulated sources.
Current usage metrics show cumulative count of Article Views (full-text article views including HTML views, PDF and ePub downloads, according to the available data) and Abstracts Views on Vision4Press platform.
Data correspond to usage on the plateform after 2015. The current usage metrics is available 48-96 hours after online publication and is updated daily on week days.
Initial download of the metrics may take a while.