Fig. 10.
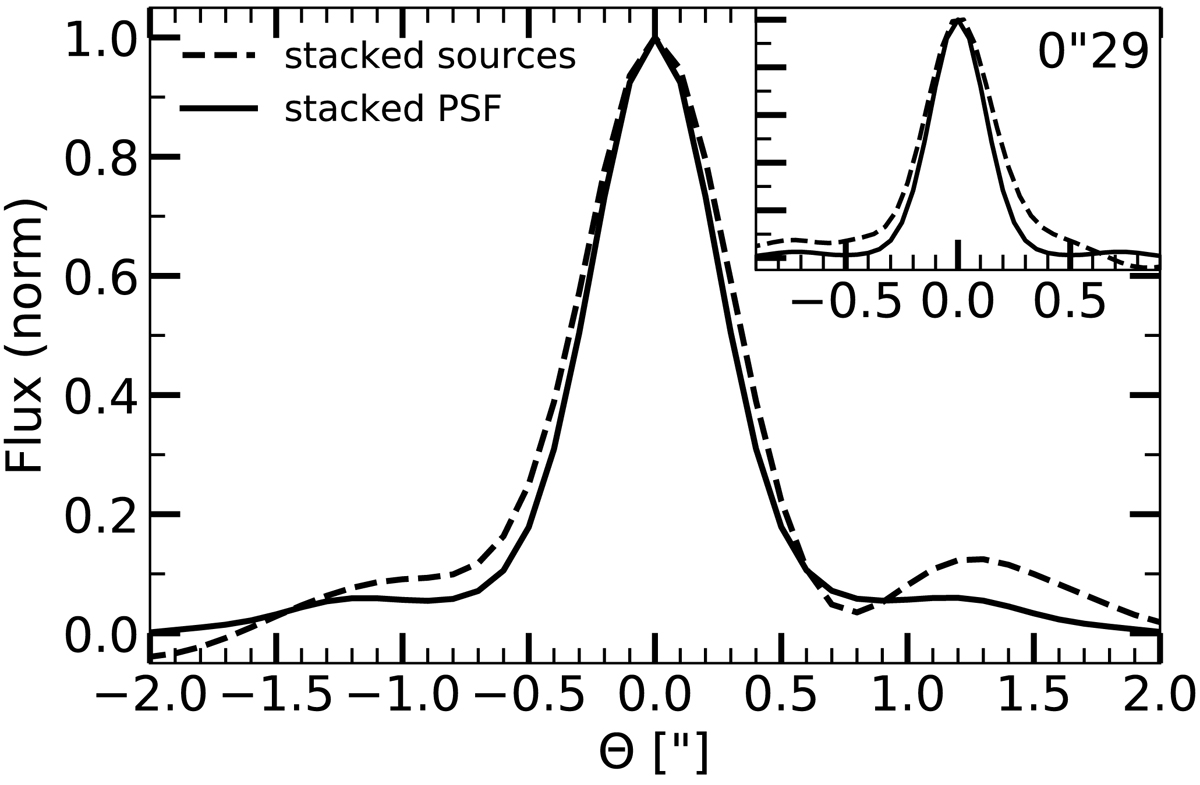
Comparison between the stacked PSF (black solid line) and the stack of the 23 ALMA-detections (black dashed line) in the 0″60-mosaic. As each slice has a specific PSF, we stack the PSF corresponding to the position of each detection. The fluxes of each detection have been normalized, so that the brightest sources do not skew the results. Fluxes of the PSF and ALMA detections are normalized to 1. Flux profiles are taken across the East–west direction. The result is consistent with unresolved or marginally resolved sources at this resolution. The insert in the top-right corner shows the same procedure for the 15 sources detected in the 0″29-mosaic (see Table 3).
Current usage metrics show cumulative count of Article Views (full-text article views including HTML views, PDF and ePub downloads, according to the available data) and Abstracts Views on Vision4Press platform.
Data correspond to usage on the plateform after 2015. The current usage metrics is available 48-96 hours after online publication and is updated daily on week days.
Initial download of the metrics may take a while.