Fig. A.1.
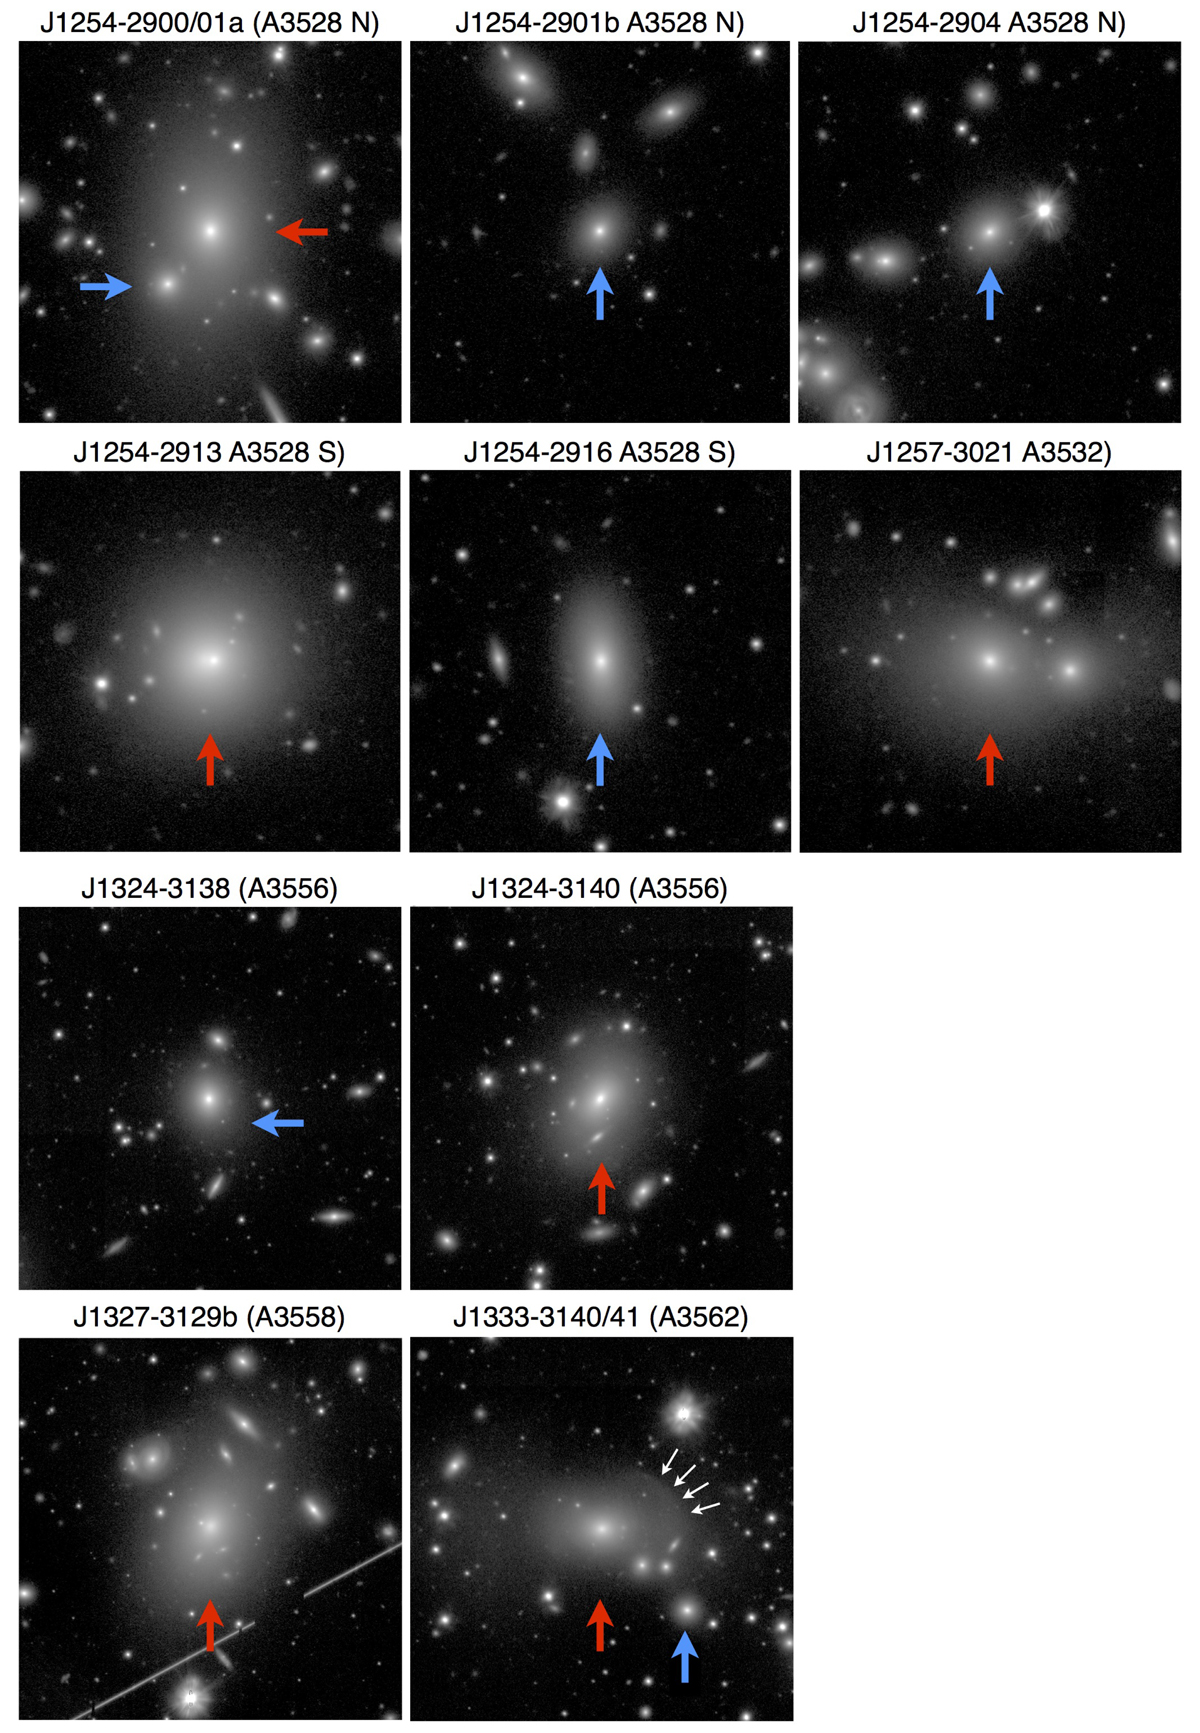
VST-OmegaCAM g-band images of the host galaxies (figure centre). Each panel has 2 arcmin sides. North is up and west to the right. Galaxies ID(s) are indicated. The six top panels show the galaxies in the A 3528 complex, while the four bottom panels show galaxies in the A 3558 complex. Red and blue arrows indicate the BCGs and the tailed radio galaxy, respectively, with the same colour code as for Figs. 1 and 2. White arrows in the last right bottom panel represent the position of the optical shell.
Current usage metrics show cumulative count of Article Views (full-text article views including HTML views, PDF and ePub downloads, according to the available data) and Abstracts Views on Vision4Press platform.
Data correspond to usage on the plateform after 2015. The current usage metrics is available 48-96 hours after online publication and is updated daily on week days.
Initial download of the metrics may take a while.